All official European Union website addresses are in the europa.eu domain.
See all EU institutions and bodiesAn official website of the European Union | How do you know?
Environmental information systems
EN
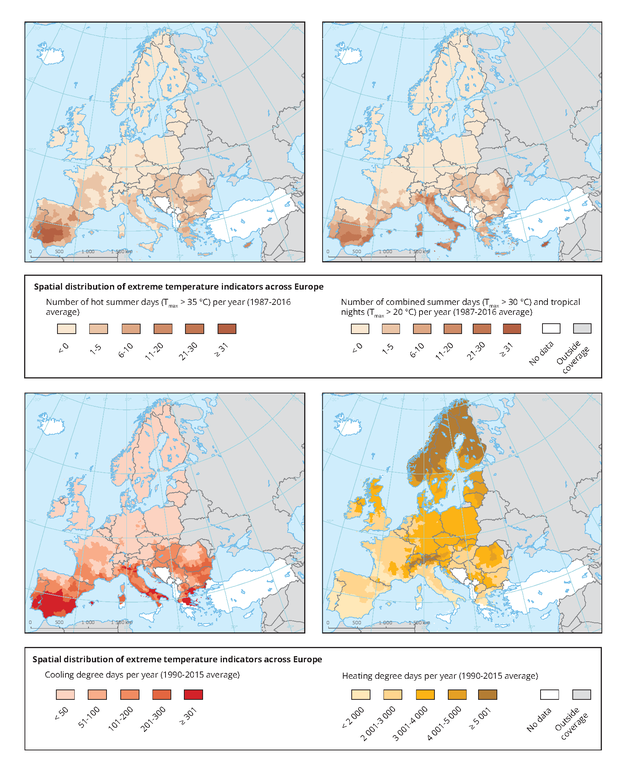
The maps use a colour gradient to show the number of hot summer days (Tmax > 35 °C) per year (1987-2016 average, top left), the number of combined summer days (Tmax > 30 °C) and tropical nights (Tmax > 20 °C) per year (1987-2016 average, top right), the cooling degree days per year (1990-2015 average, bottom left) and the heating degree days per year (1990-2015 average, bottom right).
Loading