All official European Union website addresses are in the europa.eu domain.
See all EU institutions and bodies
An official website of the European Union | How do you know?
Environmental information systems
EN

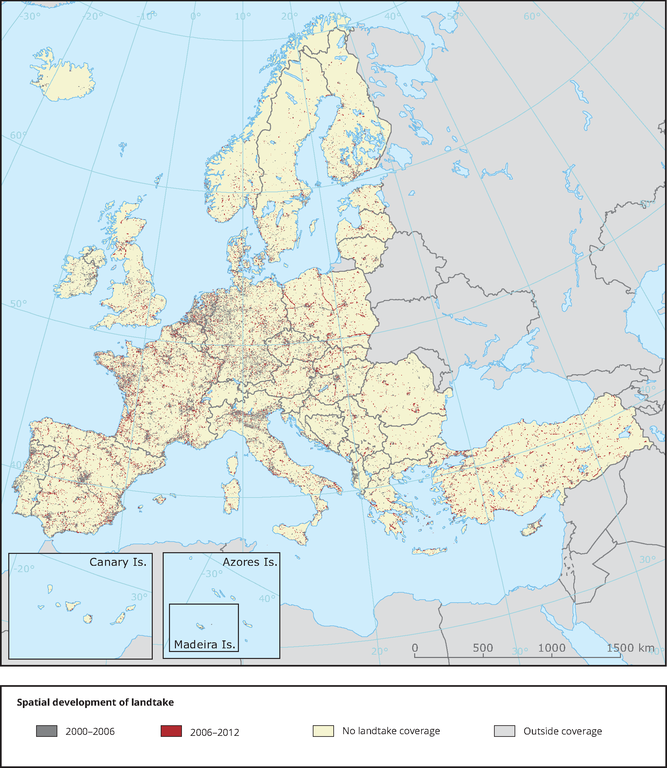
Spatial distribution of landtake in Europe over the periods 2000-2006 and 2006-2012
Loading