All official European Union website addresses are in the europa.eu domain.
See all EU institutions and bodiesAn official website of the European Union | How do you know?
Environmental information systems
EN
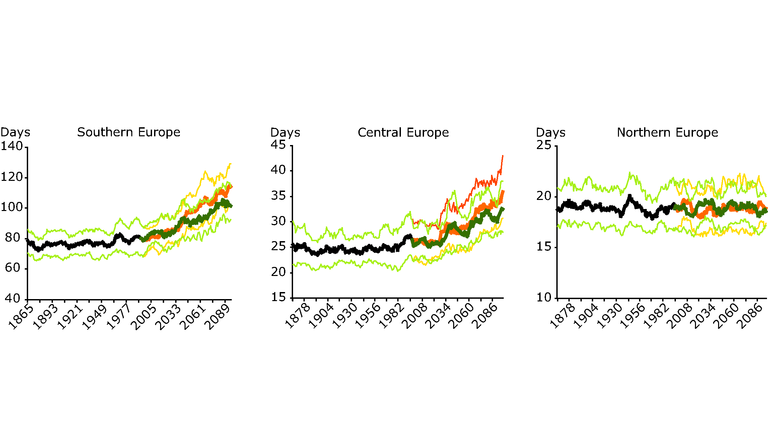
The 20th century (black), models simulations for IPCC SRES intermediate A1B (orange) and low B1 (green) emission scenarios
Loading