All official European Union website addresses are in the europa.eu domain.
See all EU institutions and bodies
An official website of the European Union | How do you know?
Environmental information systems
EN

- БългарскиBG
- češtinaCS
- HrvatskiHR
- danskDA
- NederlandsNL
- ελληνικάEL
- EnglishEN
- eestiET
- SuomiFI
- FrançaisFR
- DeutschDE
- magyarHU
- ÍslenskaIS
- italianoIT
- LatviešuLV
- lietuviųLT
- MaltiMT
- NorskNO
- polskiPL
- PortuguêsPT
- RomânăRO
- slovenčinaSK
- SlovenščinaSL
- EspañolES
- SvenskaSV
- TürkçeTR
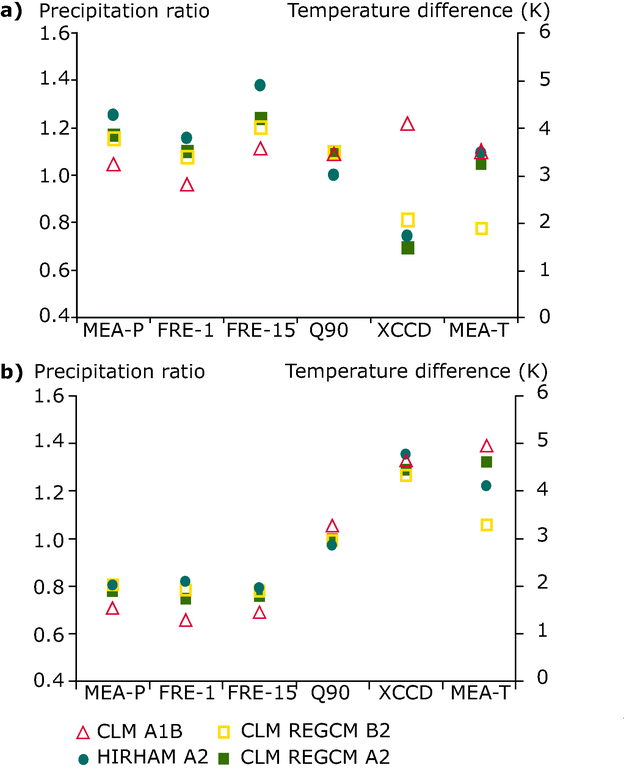
Simulated change in precipitation (2071–2100 to 1961–1990) and temperature (2071–2100 to 1961–1990) statistics in the Greater Alpine Area in (a) winter and (b) summer for four Regional Climate Models
Chart (static)
-
Downloads
Data sources
Metadata
More info
Loading
- Austria
- France
- Germany
- Italy
- Liechtenstein
- Luxembourg
- Slovenia
- Switzerland
1961-2098
Statistics: MEAP: mean climatological precipitation, FRE-1: frequency (ratio) of wet-days with precipitation > 1 mm, RE-15: frequency (ratio) of days with precipitation > 15 mm, Q90: 90 % quantile of the distribution function on wet days, XCCD: maximum number of consecutive dry days, MEA-T: mean climatological temperature.