All official European Union website addresses are in the europa.eu domain.
See all EU institutions and bodiesAn official website of the European Union | How do you know?
Environmental information systems
EN
- БългарскиBG
- češtinaCS
- HrvatskiHR
- danskDA
- NederlandsNL
- ελληνικάEL
- EnglishEN
- eestiET
- SuomiFI
- FrançaisFR
- DeutschDE
- magyarHU
- ÍslenskaIS
- italianoIT
- LatviešuLV
- lietuviųLT
- MaltiMT
- NorskNO
- polskiPL
- PortuguêsPT
- RomânăRO
- slovenčinaSK
- SlovenščinaSL
- EspañolES
- SvenskaSV
- TürkçeTR
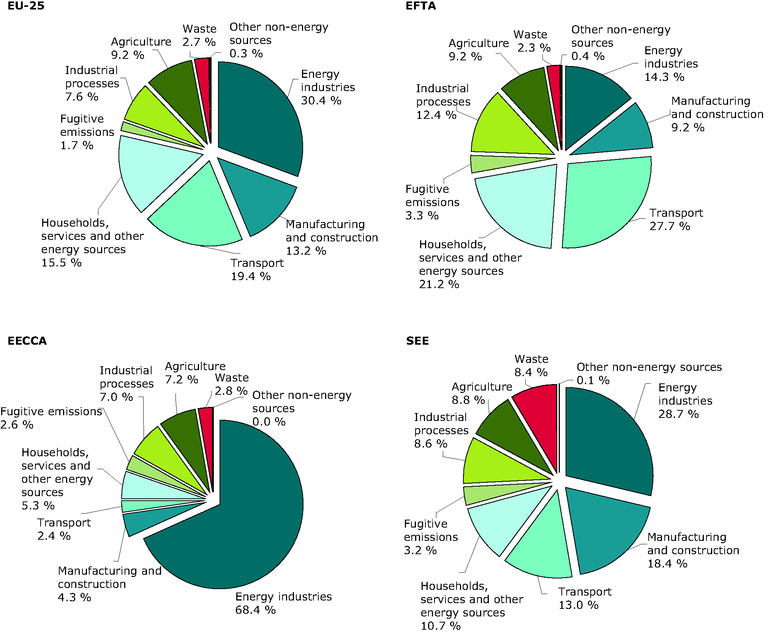
Share of total greenhouse gas emissions by sector in 2004
Chart (static)
The sectoral shares have been calculated using available sectoral data at the time of writing this chapter
Downloads
Data sources
Metadata
More info
Loading
, Albania, Armenia, Azerbaijan, Belarus, Bosnia and Herzegovina, Georgia, Kazakhstan, Kyrgyzstan, Moldova, Montenegro, Russia, Serbia, Tajikistan, Turkmenistan, Ukraine, Uzbekistan
For the EECCA countries the sectoral shares presented in the chart above fail to capture the current situation. This is mainly due to incomplete sectoral reporting by the Russian Federation. Emissions from transport and fugitive emissions were not reported separately in their NC4, and seemed to have been included under energy industries. The Russian Federation submitted their greenhouse gas national inventory report and CRF tables to the UNFCCC in January 2007. According to the CRF for 2004, fugitive emissions account for about 10 % of total greenhouse gas emissions. Transport was not reported separately. Since the Russian Federation represents more than 2/3 of the total emissions in the EECCA countries, the share of fugitive emissions in EECCA countries would be closer to 99.5 %. The volume of emissions in million tonnes of CO2-equivalents in 2004 was: EU25 = 4 980; EECCA = 2 996; SEE = 599; EFTA = 111.