All official European Union website addresses are in the europa.eu domain.
See all EU institutions and bodiesAn official website of the European Union | How do you know?
Environmental information systems
EN
- БългарскиBG
- češtinaCS
- HrvatskiHR
- danskDA
- NederlandsNL
- ελληνικάEL
- EnglishEN
- eestiET
- SuomiFI
- FrançaisFR
- DeutschDE
- magyarHU
- ÍslenskaIS
- italianoIT
- LatviešuLV
- lietuviųLT
- MaltiMT
- NorskNO
- polskiPL
- PortuguêsPT
- RomânăRO
- slovenčinaSK
- SlovenščinaSL
- EspañolES
- SvenskaSV
- TürkçeTR
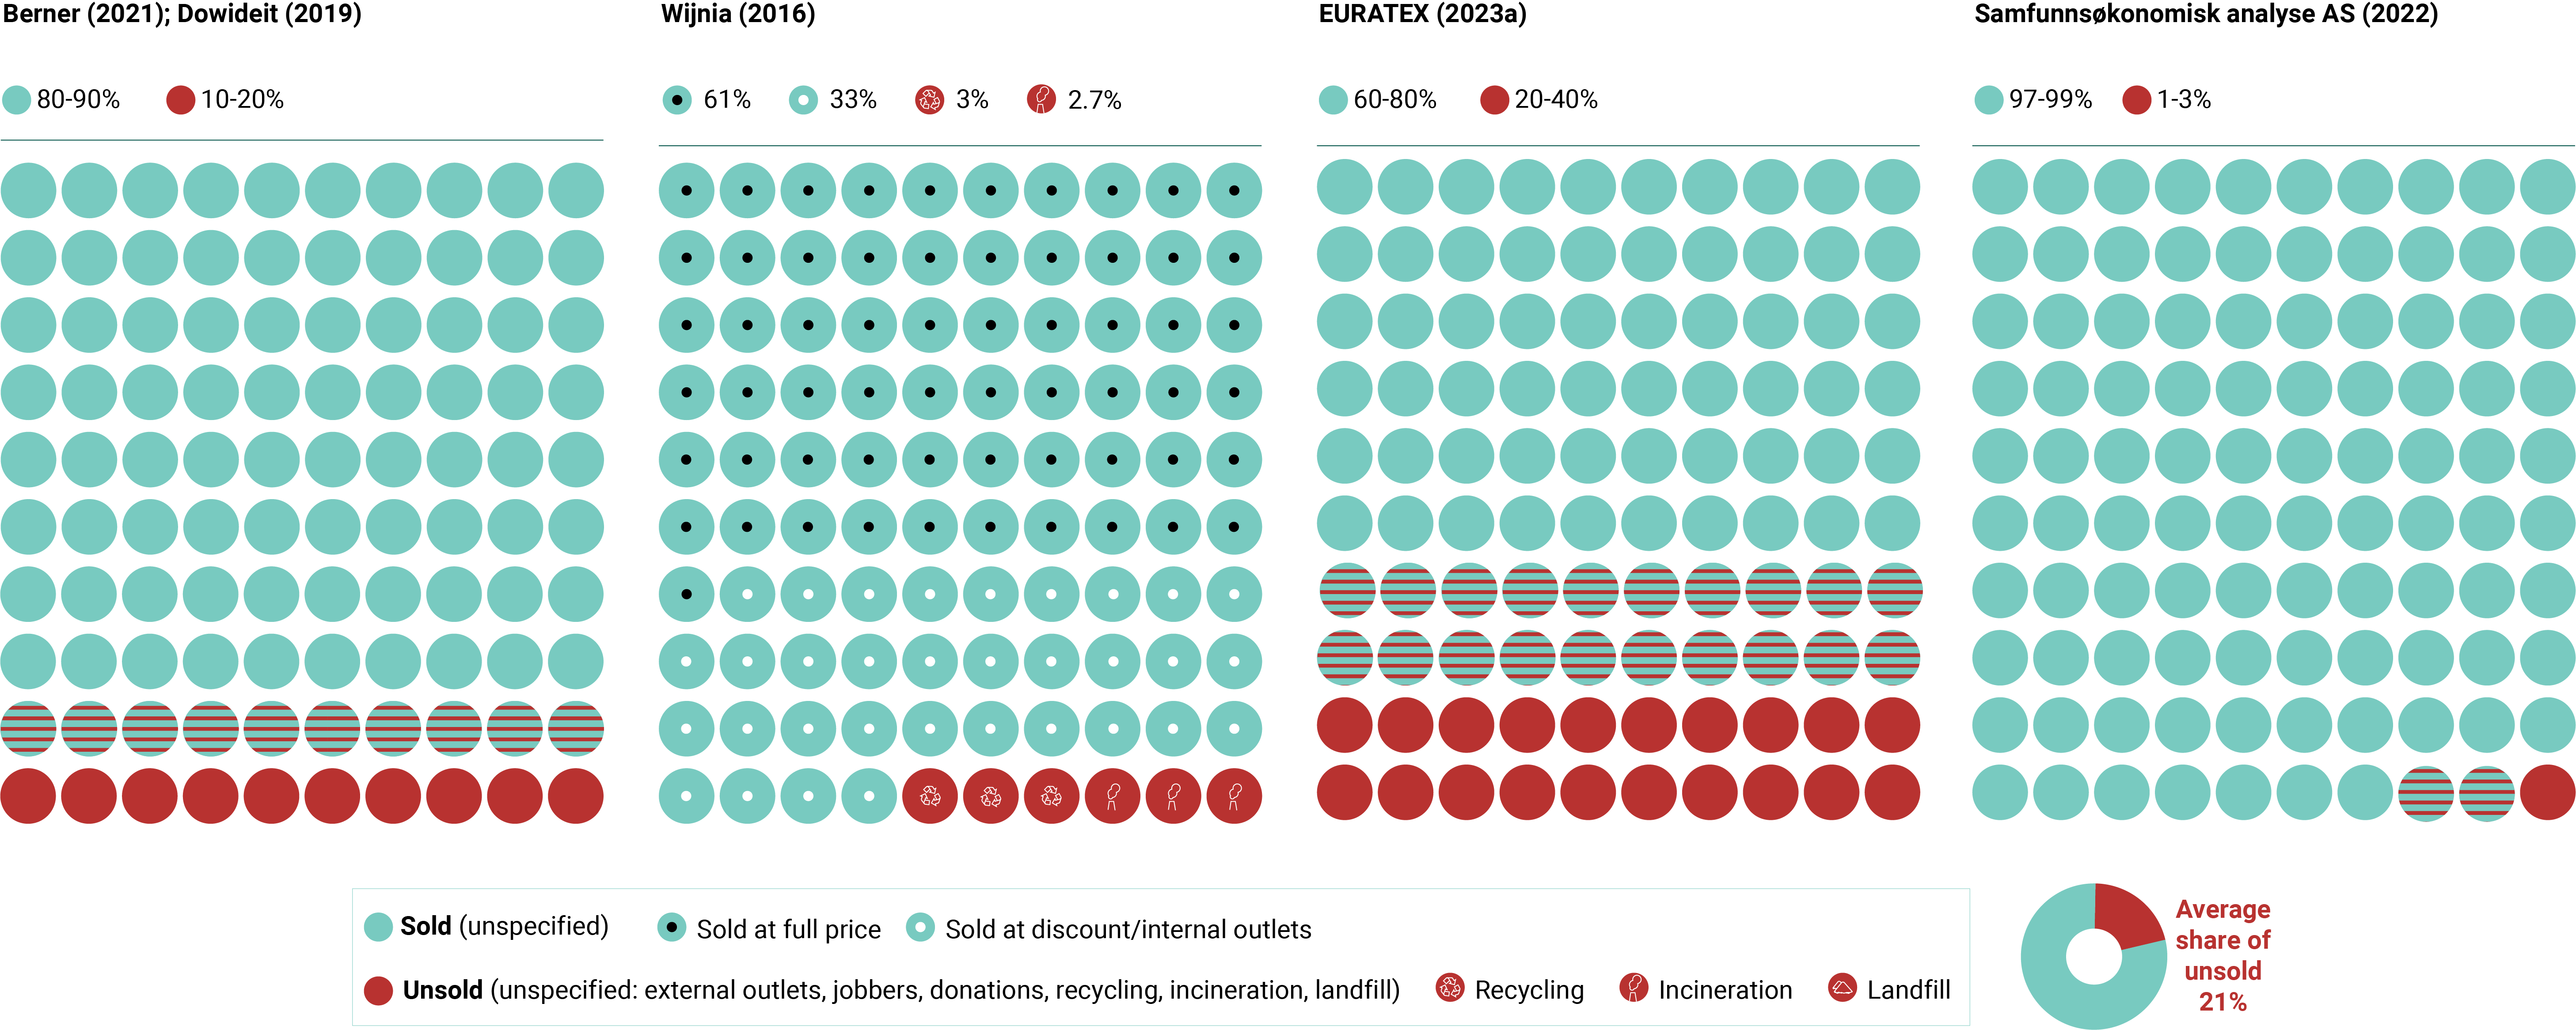
Share of textiles unsold according to available sources, per cent
Chart (static)
Downloads
Data sources
Metadata
More info
Loading
- Overskudd av klær fra klesbransjen i Norge (Surplus clothing from the clothing industry in Norway), Samfunnsøkonomisk analyse AS
- Mapping obsolete inventory in the Dutch apparel industry - A qualitative and quantitative analysis of discounted and unsold volumes in apparel, Wijnia, G
- Additional information provided to the draft ETC/CE report on ‘volumes and destruction of returned and unsold textiles in Europe, EURATEX
- Austria
- Belgium
- Bulgaria
- Croatia
- Cyprus
- Czechia
- Denmark
- Estonia
- Finland
- France
- Germany
- Greece
- Hungary
- Ireland
- Italy
- Latvia
- Lithuania
- Luxembourg
- Malta
- Norway
- Poland
- Portugal
- Romania
- Slovakia
- Slovenia
- Spain
- Sweden
- The Netherlands
2015
2018-2019
2021-2022