All official European Union website addresses are in the europa.eu domain.
See all EU institutions and bodiesAn official website of the European Union | How do you know?
Environmental information systems
EN
Loading
All official European Union website addresses are in the europa.eu domain.
See all EU institutions and bodiesChart (static)
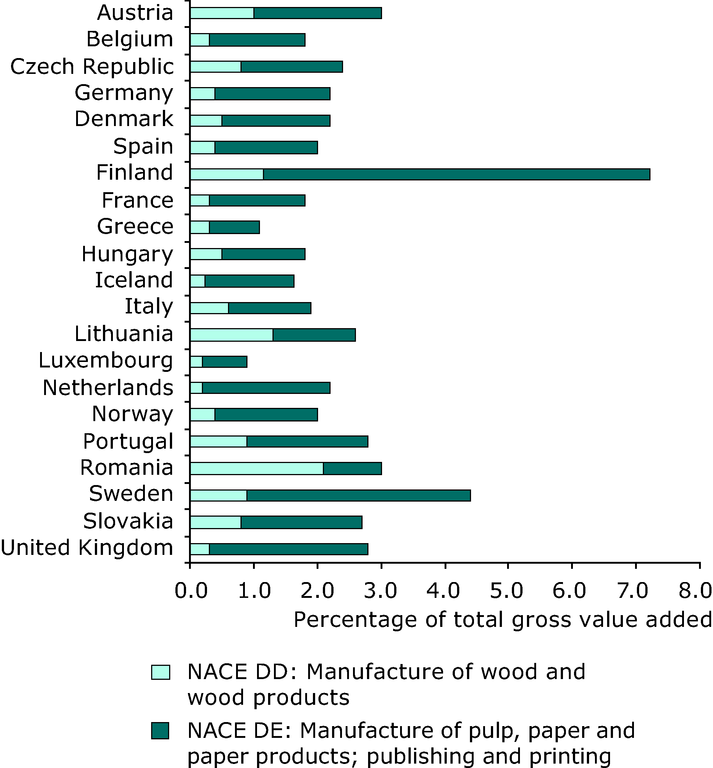
Note that the graph does not inlude the NACE section A category (Agriculture, Forestry and Hunting) as data was not available to disaggregate it into individual components.