All official European Union website addresses are in the europa.eu domain.
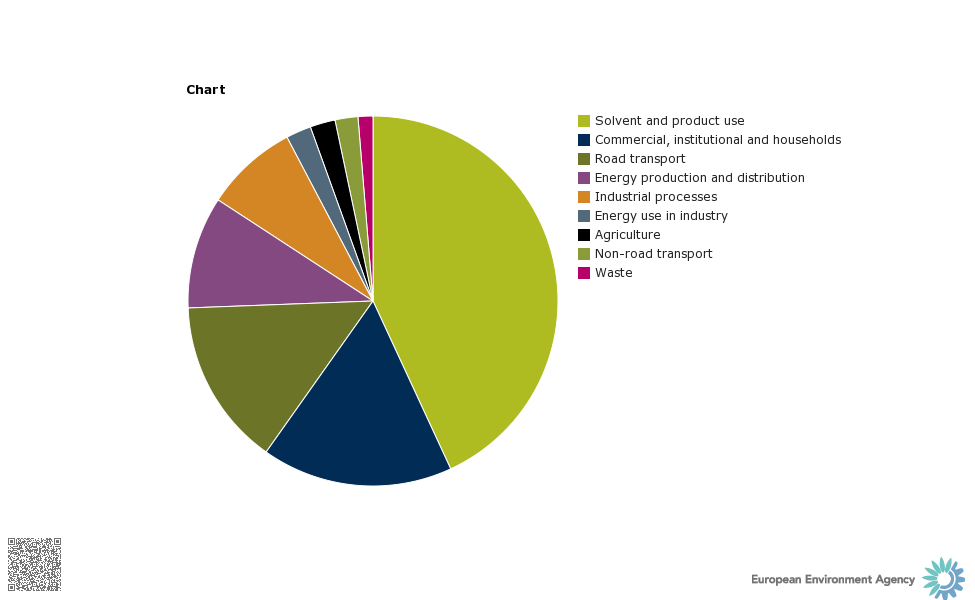
Chart (static)Published 29 Jan 2014Modified 18 Jun 2015