All official European Union website addresses are in the europa.eu domain.
See all EU institutions and bodiesDo something for our planet, print this page only if needed. Even a small action can make an enormous difference when millions of people do it!
Figure
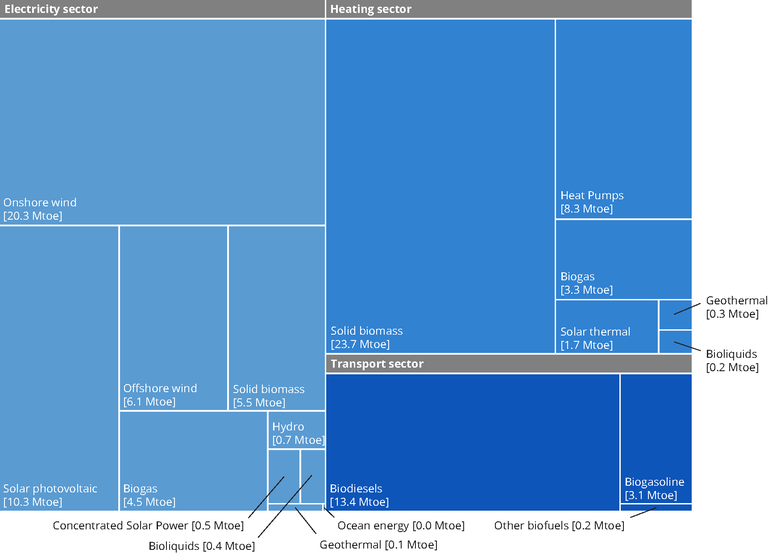
The figure illustrates how much renewable energy consumption has grown by 2018 across the EU-28, compared with corresponding levels per technology and sector in 2005.
For references, please go to https://www.eea.europa.eu/data-and-maps/figures/res-growth-effects-on-primary or scan the QR code.
PDF generated on 05 Jun 2023, 02:42 PM
Engineered by: EEA Web Team
Software updated on 12 March 2023 21:56 from version 23.1.28
Software version: EEA Plone KGS 23.3.11
Document Actions
Share with others