All official European Union website addresses are in the europa.eu domain.
See all EU institutions and bodiesAn official website of the European Union | How do you know?
Environmental information systems
EN
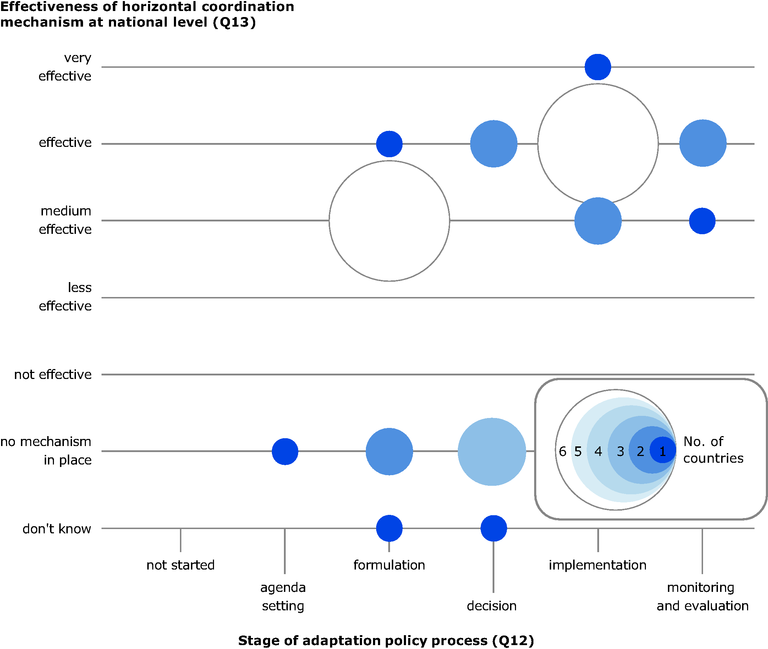
The graph combines information on countries' perceptions on the effectiveness of their horizontal coordination mechanism together with information on the stage of their adaptation policy process. Bubble sizes indicate the number of countries in a given stage of adaptation policy process with a similar perception of the effectiveness of their horizontal coordination mechanism.
Loading