All official European Union website addresses are in the europa.eu domain.
See all EU institutions and bodies
An official website of the European Union | How do you know?
Environmental information systems
EN

- БългарскиBG
- češtinaCS
- HrvatskiHR
- danskDA
- NederlandsNL
- ελληνικάEL
- EnglishEN
- eestiET
- SuomiFI
- FrançaisFR
- DeutschDE
- magyarHU
- ÍslenskaIS
- italianoIT
- LatviešuLV
- lietuviųLT
- MaltiMT
- NorskNO
- polskiPL
- PortuguêsPT
- RomânăRO
- slovenčinaSK
- SlovenščinaSL
- EspañolES
- SvenskaSV
- TürkçeTR
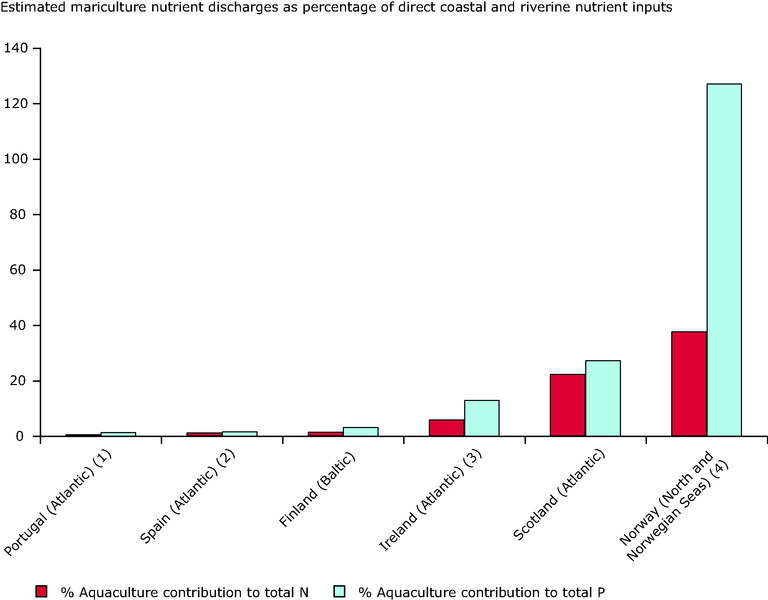
Relative contribution of nutrients from marine and brackish water finfish culture in selected countries, 1999
Chart (static)
1
Downloads
Data sources
Metadata
More info
Loading
- Finland
- Ireland
- Norway
- Portugal
- Spain
- United Kingdom
Nitrogen load figure limited to riverine discharge only (no data on direct inputs). 2. Phosphorus load: average of lower and upper estimates. 3. Total N for riverine discharge estimated as NH3-N+NO3-N. This will overestimate the relative N loads from aquaculture. 4. Nutrient loads applicable to sea areas in which the bulk of marine and / or brackishwater finfish aquaculture takes place have been used. These figures do not include N and P discharges from inland aquaculture production. The proportion of aquaculture production which results in nutrient waste is based upon the mid-range of values stated in the OSPAR 2000 report (55g N /production Kg ( 5.5%) and 7.5g P /production Kg (0.75%)). The figures for Finland are based upon the HELCOM 1998. This gives both the total loads and the aquaculture load, therefore the OSPAR 2000 water ratio figure is not required to calculate aquaculture percentage of total. Production figures relate to marine species only, except Finland, which refers to brackish water production.