All official European Union website addresses are in the europa.eu domain.
See all EU institutions and bodiesAn official website of the European Union | How do you know?
Environmental information systems
EN
- БългарскиBG
- češtinaCS
- HrvatskiHR
- danskDA
- NederlandsNL
- ελληνικάEL
- EnglishEN
- eestiET
- SuomiFI
- FrançaisFR
- DeutschDE
- magyarHU
- ÍslenskaIS
- italianoIT
- LatviešuLV
- lietuviųLT
- MaltiMT
- NorskNO
- polskiPL
- PortuguêsPT
- RomânăRO
- slovenčinaSK
- SlovenščinaSL
- EspañolES
- SvenskaSV
- TürkçeTR
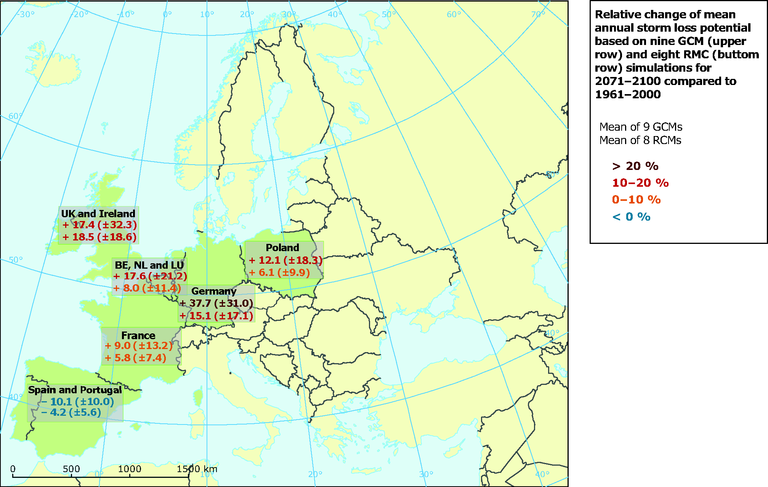
Relative change of mean annual storm loss potential on nine GCM (upper row) and eight RCM (bottom row) simulations for 2071–2100 compared to 1961–2000 (SRES A1B scenario)
Map (static)
-
Downloads
Data sources
Metadata
More info
Loading
- Future changes in European winter storm losses and extreme wind speeds
- Greece
- Poland
- Portugal
- Spain
- United Kingdom
- Netherlands
- Belgium
- Germany
- France
- Czechia
- Italy
- Cyprus
- Estonia
- Latvia
- Lithuania
- Finland
- Hungary
- Malta
- Denmark
- Sweden
- Austria
- Luxembourg
- Ireland
- Slovakia
- Slovenia
1961-2000
2071-2098