All official European Union website addresses are in the europa.eu domain.
See all EU institutions and bodiesAn official website of the European Union | How do you know?
Environmental information systems
EN
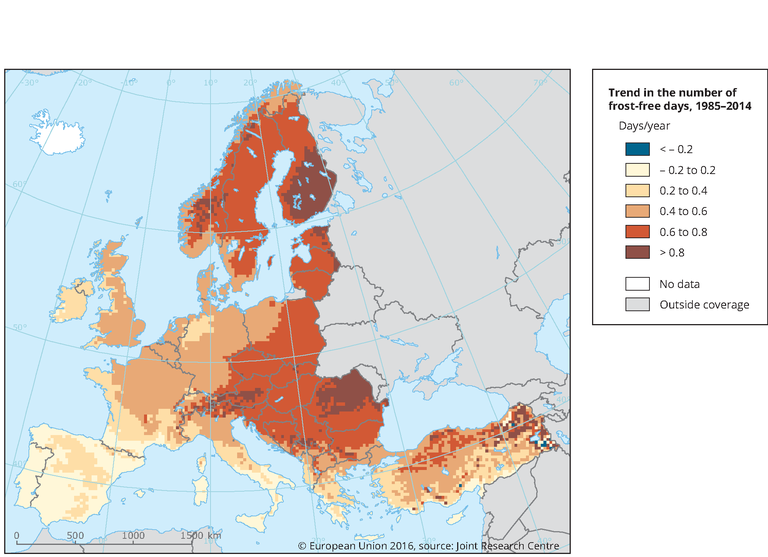
The annual rate of change of frost-free days represents the trend coefficient for long-term changes in the annual number of days with a minimum daily temperature above 0 °C. For example, a value of 1 indicates that the number of frost-free days has increased on average by 1 day per year in last 30 years (period 1985-2014). The analysis is based on the JRC-MARS gridded meteorological data at 25 km resolution.
Loading