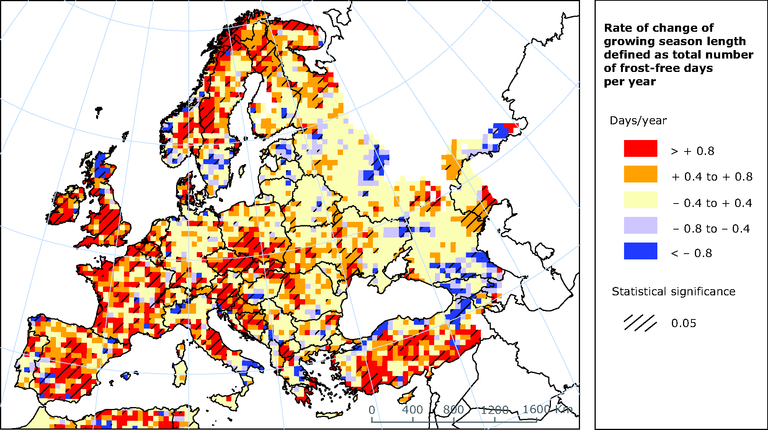
Figure
Rate of change of crop growing season length 1975-2007
Download
- map 5.40 climate change 2008 - annual change in crop growing season.eps.75dpi.gif (869.3 KB)
- map 5.40 climate change 2008 - annual change in crop growing season.eps.75dpi.tif (6.5 MB)
- map 5.40 climate change 2008 - annual change in crop growing season.eps.75dpi.png (128.8 KB)
- Original file application/postscript (3.04 MB)
Metadata
Permalinks
- Permalink to this version
- 06396C06-C141-4F43-A725-3514DBC84E79
- Permalink to latest version
- 22BD54EE-2652-45AE-AAC8-BE2A207011FF
Geographic coverage
Temporal coverage
For references, please go to https://www.eea.europa.eu/data-and-maps/figures/rate-of-change-of-crop-growing-season-length-1975-2007 or scan the QR code.
PDF generated on 28 Jan 2023, 06:59 PM
Document Actions
Share with others