All official European Union website addresses are in the europa.eu domain.
See all EU institutions and bodies
An official website of the European Union | How do you know?
Environmental information systems
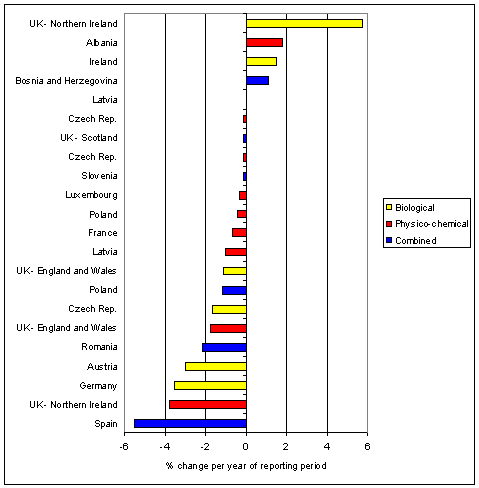
Different types of schemes cannot really be compared hence the graph is divided into the classification types used (biological, physico-chemical, combined)