All official European Union website addresses are in the europa.eu domain.
See all EU institutions and bodiesAn official website of the European Union | How do you know?
Environmental information systems
EN
- БългарскиBG
- češtinaCS
- HrvatskiHR
- danskDA
- NederlandsNL
- ελληνικάEL
- EnglishEN
- eestiET
- SuomiFI
- FrançaisFR
- DeutschDE
- magyarHU
- ÍslenskaIS
- italianoIT
- LatviešuLV
- lietuviųLT
- MaltiMT
- NorskNO
- polskiPL
- PortuguêsPT
- RomânăRO
- slovenčinaSK
- SlovenščinaSL
- EspañolES
- SvenskaSV
- TürkçeTR
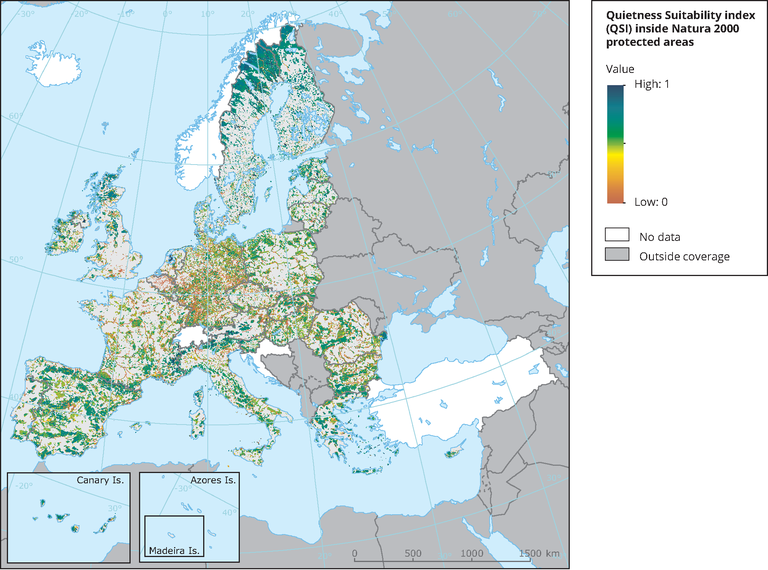
Quietness Suitability Index (QSI) and Natura 2000
Map (static)
The map shows the index of suitable quiet areas across Europe combined with the Natura2000 protected areas
Downloads
Data sources
Metadata
More info
Loading
, Iceland, Liechtenstein, Norway, Switzerland
2016
Suitable distance layer from noise sources built following a fuzzy approach (*), calculating the 'membership' to the quietness range (0–1) by means of a linear relationship, considering the mean value obtained as no suitable (= 0) and maximum distance obtained as suitable (= 1). The distance values between not suitable (mean value) and suitable (maximum value) will be reassigned with a new value between 0 and 1 following a linear equation. The noise map has been combined with the Natura 2000 data for Europe.
(*) The production of threshold distance layers around noise sources has been made following a fuzzy approach rather than obtaining a buffer with sharp limits. Membership to a 0-1 range has been obtained according to a linear function.
Full methodology: Good practice guide on quiet areas.Technical report No 4/2014
http://www.eea.europa.eu/publications/good-practice-guide-on-quiet-areas