All official European Union website addresses are in the europa.eu domain.
See all EU institutions and bodiesAn official website of the European Union | How do you know?
Environmental information systems
EN
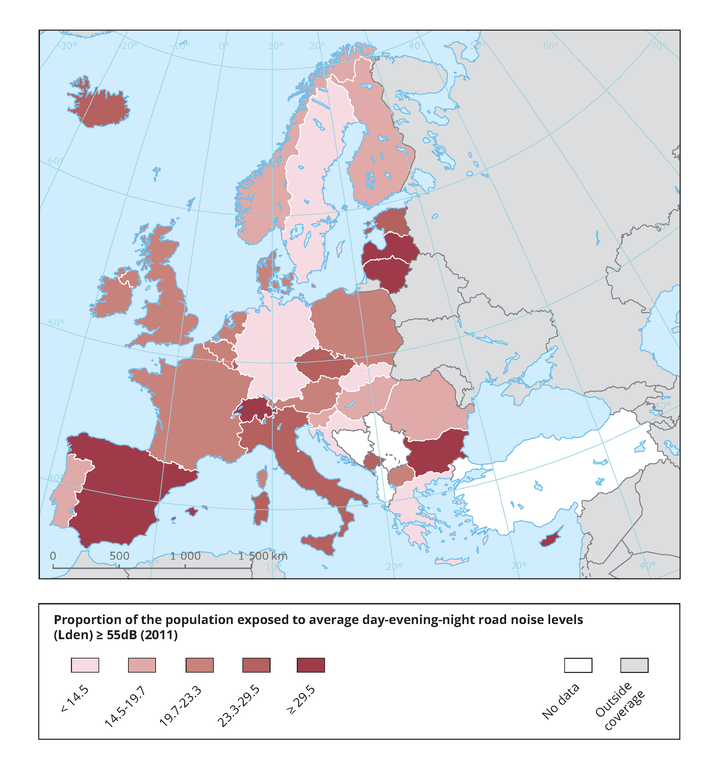
This map shows the proportion of the population per country exposed to road traffic noise at or above 55 dB Lden (average day-evening-night noise levels).
Loading