next
previous
items

Figure

Percentage of classified water bodies in different river basin districts (RBDs) affected by pollution pressures, for rivers and lakes (top panel) and for coastal and transitional waters (bottom panel)

Figure Created 15 Oct 2014 Last modified 11 Sep 2015
1 min read
This is an old version, kept for reference only.

Go to latest version
This page was archived on 16 Jun 2015 with reason: Other (New version data-and-maps/figures/proportion-of-classified-water-bodies-4 was published)
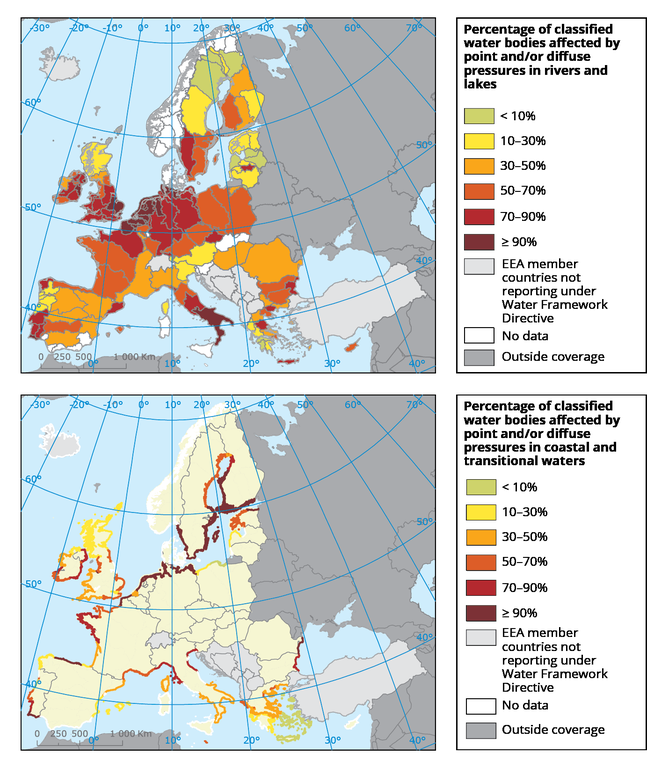
The percentage is based on total number of classified water bodies. See the indicator specification for more details.

Download

Metadata

Additional information

See the EEA ETC/ICM technical report for more details and the methodology used for assessing pressures (EEA ETC/ICM, 2012a).
A water body is considered to be affected by pollution pressures if it is reported with the aggregated pressure type 'Point sources' and/or 'Diffuse sources' and/or any of the corresponding disaggregated pressure types (e.g. urban wastewater, industry emissions or agriculture diffuse pollution). Swedish surface water bodies are defined as not affected by diffuse pollution pressures if the only reported diffuse pollution pressure is airborne mercury contamination.

Permalinks

Geographic coverage

Temporal coverage