All official European Union website addresses are in the europa.eu domain.
See all EU institutions and bodiesAn official website of the European Union | How do you know?
Environmental information systems
EN
- БългарскиBG
- češtinaCS
- HrvatskiHR
- danskDA
- NederlandsNL
- ελληνικάEL
- EnglishEN
- eestiET
- SuomiFI
- FrançaisFR
- DeutschDE
- magyarHU
- ÍslenskaIS
- italianoIT
- LatviešuLV
- lietuviųLT
- MaltiMT
- NorskNO
- polskiPL
- PortuguêsPT
- RomânăRO
- slovenčinaSK
- SlovenščinaSL
- EspañolES
- SvenskaSV
- TürkçeTR
Projected progress towards EU‑15 Kyoto target
Chart (static)
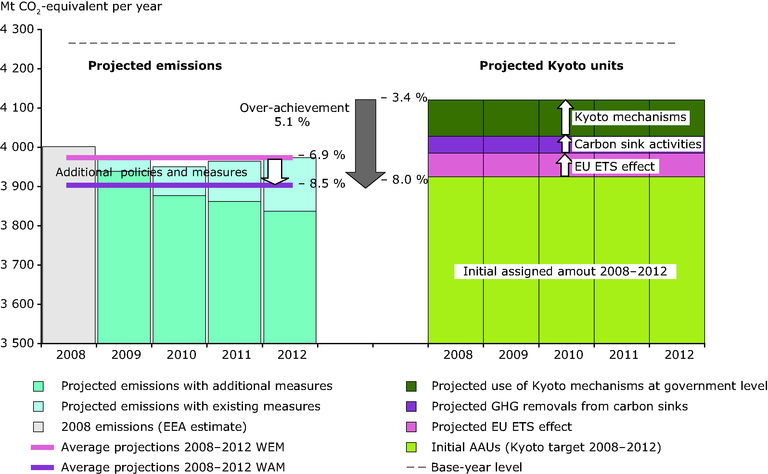
Summary of EU‑15 projections of greenhouse gas emissions compared to projected Kyoto units

Downloads
Data sources
Metadata
More info
Loading
- Austria
- Belgium
- Denmark
- Finland
- France
- Germany
- Greece
- Ireland
- Italy
- Luxembourg
- Netherlands
- Portugal
- Spain
- Sweden
- United Kingdom
2008-2012
The left section presents the projected emissions considering domestic measures (existing and additional) shown as average 2008–2012 emissions (lines) and annual emissions (bars). The right section shows the assigned amount units and the contribution of the EU ETS, carbon sink activities and the use of Kyoto mechanisms.