All official European Union website addresses are in the europa.eu domain.
See all EU institutions and bodiesAn official website of the European Union | How do you know?
Environmental information systems
EN
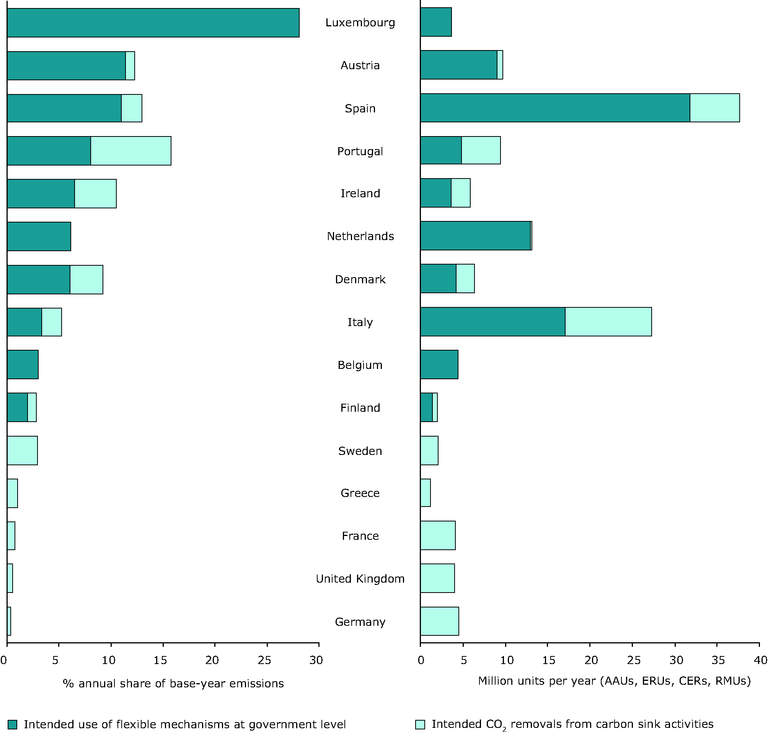
Projected contributions of the Kyoto mechanisms and carbon sinks on the overall change of assigned amounts
Loading