All official European Union website addresses are in the europa.eu domain.
See all EU institutions and bodiesAn official website of the European Union | How do you know?
Environmental information systems
EN
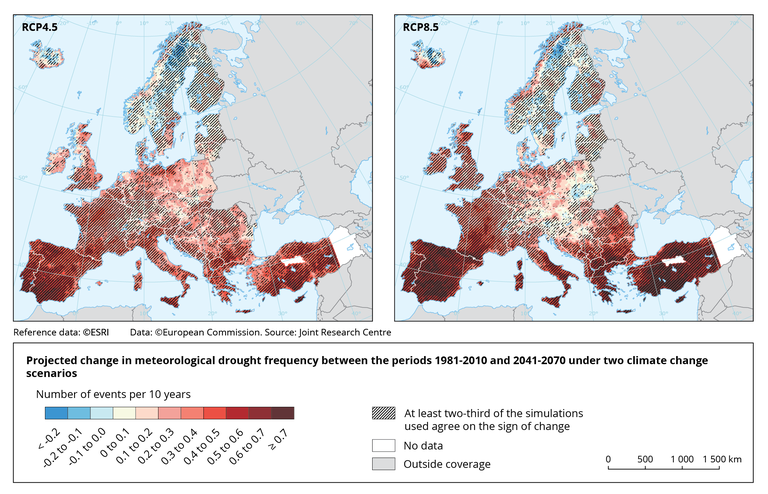
Left map: Scenario RCP4.5 (Representative Concentration Pathway).
Right map: Scenario RCP8.5 (Representative Concentration Pathway).The line pattern represents the areas in which at least two-third of the simulations used agree on the sign of the change.
Loading