All official European Union website addresses are in the europa.eu domain.
See all EU institutions and bodies
An official website of the European Union | How do you know?
Environmental information systems
EN

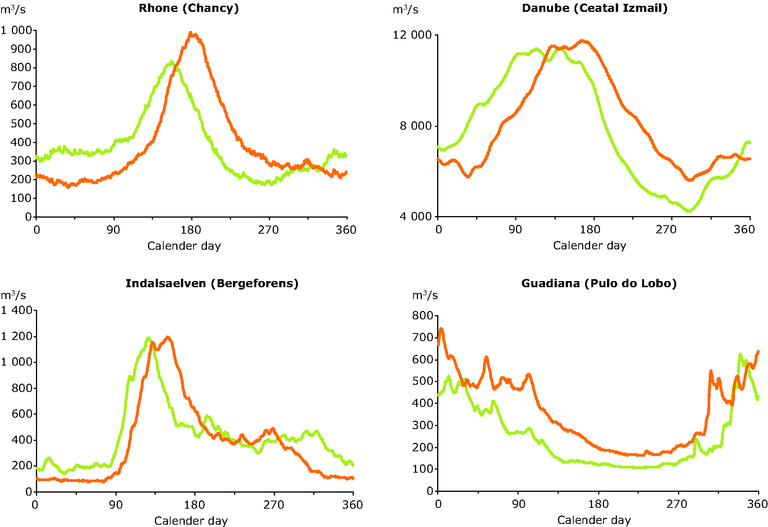
Projected river flow 2071-2100 (green line) and the observed river flow 1961-1990
(orange line)
Loading