All official European Union website addresses are in the europa.eu domain.
See all EU institutions and bodiesAn official website of the European Union | How do you know?
Environmental information systems
EN
- БългарскиBG
- češtinaCS
- HrvatskiHR
- danskDA
- NederlandsNL
- ελληνικάEL
- EnglishEN
- eestiET
- SuomiFI
- FrançaisFR
- DeutschDE
- magyarHU
- ÍslenskaIS
- italianoIT
- LatviešuLV
- lietuviųLT
- MaltiMT
- NorskNO
- polskiPL
- PortuguêsPT
- RomânăRO
- slovenčinaSK
- SlovenščinaSL
- EspañolES
- SvenskaSV
- TürkçeTR
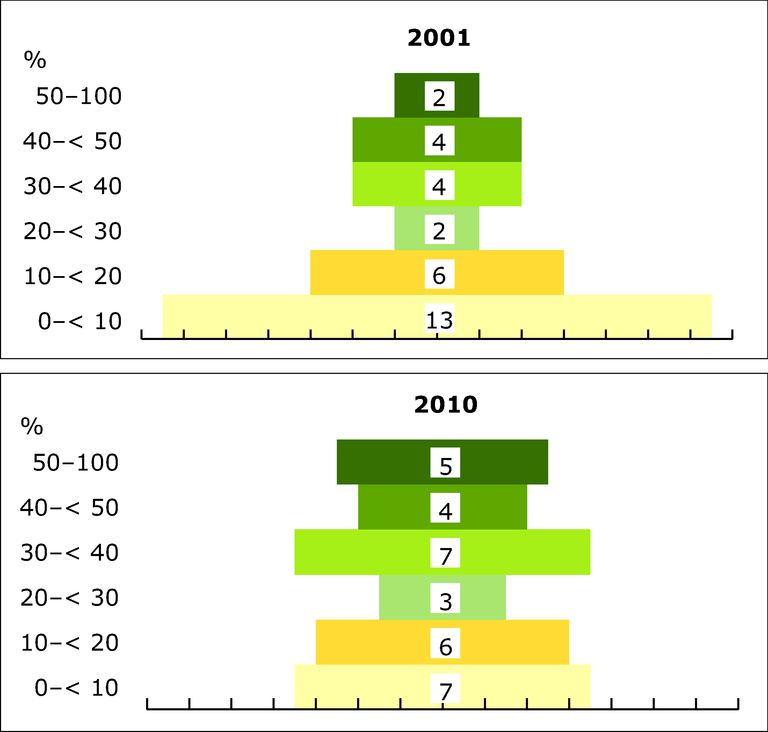
Progress of European countries up the recycling hierarchy (material and bio-waste recycling), 2001–2010
Chart (static)
The number of countries achieving defined intervals of total recycling in 2001 and 2010.
Downloads
Data sources
Metadata
More info
Loading
- Municipal waste management in Austria
- Municipality waste management in Italy (Rapporto Rifiuti Urbani 2012 — Italiano - Ispra)
- Municipal waste management in Iceland
- Municipal waste by waste management operations (env_wasmun)
- Municipal waste management in Luxembourg
- Municipal waste management in Slovenia
- Municipal waste by NUTS 2 regions - pilot project
- Austria
- Belgium
- Bulgaria
- Croatia
- Cyprus
- Czechia
- Denmark
- Estonia
- Europe
- Finland
- France
- Germany
- Greece
- Hungary
- Iceland
- Ireland
- Italy
- Latvia
- Lithuania
- Luxembourg
- Malta
- Netherlands
- Norway
- Poland
- Portugal
- Romania
- Slovakia
- Slovenia
- Spain
- Sweden
- Switzerland
- Turkey
- United Kingdom
2001-2010
Methodology
The recycling rates are calculated as share of municipal waste recycled (material recycling + organic recycling) and the countries are then grouped into categories.
Additional information
Notes: The greener the bars, the higher the recycling rate. Number of countries within each recycling category indicated in the white boxes. Information is not available for one country in 2001. Total recycling includes material recycling as well as composting and digestion of bio-waste.
For Iceland 2008 data is used for 2010. For Slovenia 2002 data are used for 2001 and 2009 data are used for 2010. Croatia is not included for 2001