All official European Union website addresses are in the europa.eu domain.
See all EU institutions and bodies
An official website of the European Union | How do you know?
Environmental information systems
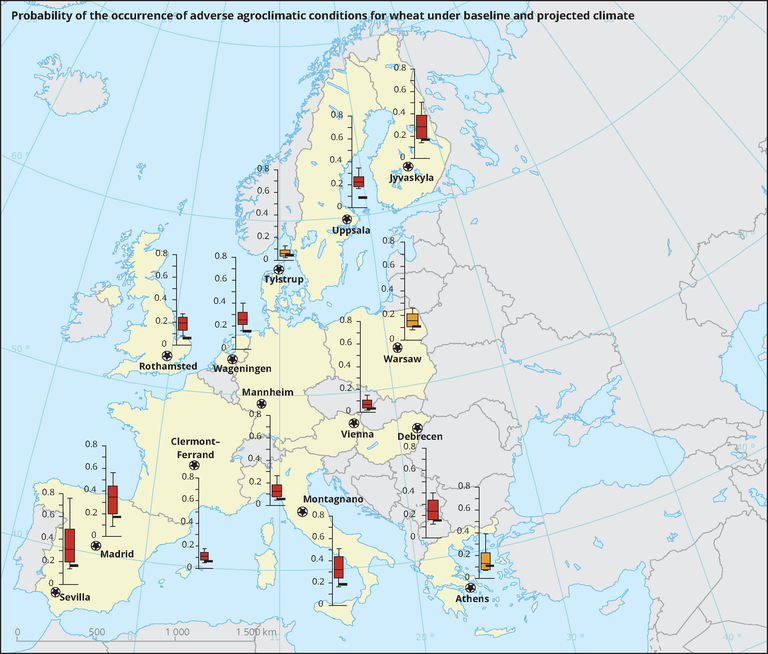
This map compares the probability that at least one out of 11 types of adverse agroclimatic conditions occurs between sowing and majority of wheat (medium-ripening cultivar) under baseline climate (1981, black bar) and projected climate (2060, coloured box). Red boxes indicate that at least 14 out of the 16 CMIP5 models show an increased probability of adverse conditions, and orange boxes indicate that at least 9 out of 16 models show an increased probability.
Loading