All official European Union website addresses are in the europa.eu domain.
See all EU institutions and bodies
An official website of the European Union | How do you know?
Environmental information systems
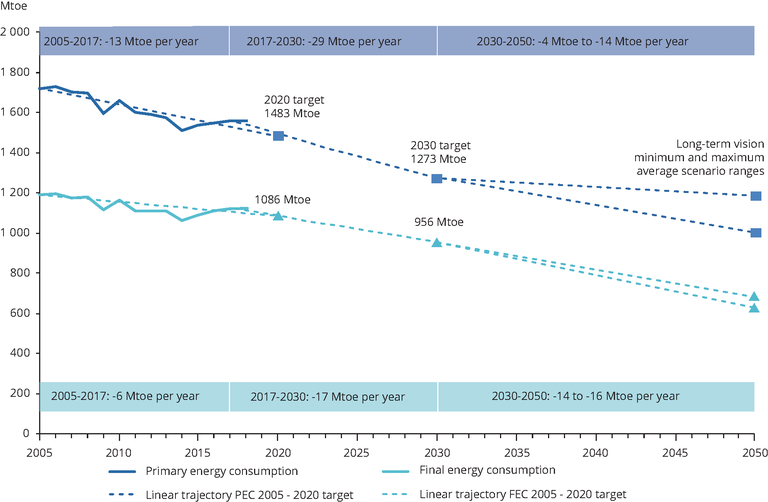
Primary and final energy consumption in the EU, 2005-2016, 2020 and 2030 targets and 2050 indicative levels of the EU Energy Roadmap
Chart (static)
The solid line shows the development of primary energy consumption and final energy consumption. The dashed lines show the linear trajectories until 2030 and to the 2050 scenario results from the Commission's 2050 long term strategy.
Downloads
Data sources
Metadata
More info
Loading
- Indicative trajectories for the share of energy from renewable sources in gross final consumption of energy, from national renewable energy action plans (NREAPs)
- Increased energy efficiency: ensuring progress towards EU's climate and energy goals
- Energy Efficiency Directive
- Final energy consumption by sector
- Primary Energy Consumption (t2020_33)
- Austria
- Belgium
- Bulgaria
- Croatia
- Cyprus
- Czechia
- Denmark
- Estonia
- Finland
- France
- Germany
- Greece
- Hungary
- Ireland
- Italy
- Latvia
- Lithuania
- Luxembourg
- Malta
- Netherlands
- Poland
- Portugal
- Romania
- Slovakia
- Slovenia
- Spain
- Sweden
- United Kingdom
2005-2050
Methodology
Based on:
• Primary and final energy consumption data from Eurostat, reported by MS under the Energy Statistics Regulation (EC) No 1099/2008 and published in the energy statistics database.
Targets and trajectories based on:
• Directive 2012/27/EU of the European Parliament and of the Council of 25 October 2012 on energy efficiency, amending Directives 2009/125/EC and 2010/30/EU and repealing Directives 2004/8/EC and 2006/32/EC and updates by MS in their national energy efficiency action plans (NEEAPs).The energy efficiency target for 2020 is defined as an absolute target, set 20 % below the level in primary energy consumption projected for 2020 in the 2007 Energy Baseline scenario of the European Commission.
• 2050 Long term stategy https://ec.europa.eu/clima/policies/strategies/2050_en
Additional information
The 2020 target represents energy savings of 20 % from levels projected for 2020 in the Commission's Energy Baseline Scenario. The indicative 2030 energy efficiency target represents an improved energy efficiency of at least 30 % compared with 2030 projections in the same Energy Baseline Scenario. The 2050 scenario range illustrates the an average of eight scenarios published in the Commission's 2050 long term strategy.
In this assessment the target is expressed as a relative change compared to 2005 levels of EU primary energy consumption, to show the required reduction in primary energy consumption over time. The year 2005 was chosen because it is used as a base year for GHG (in the EU ETS and under the ESD) and for renewable energy targets. It also corresponds to a peak in energy consumption in the EU.