All official European Union website addresses are in the europa.eu domain.
See all EU institutions and bodies
An official website of the European Union | How do you know?
Environmental information systems
EN

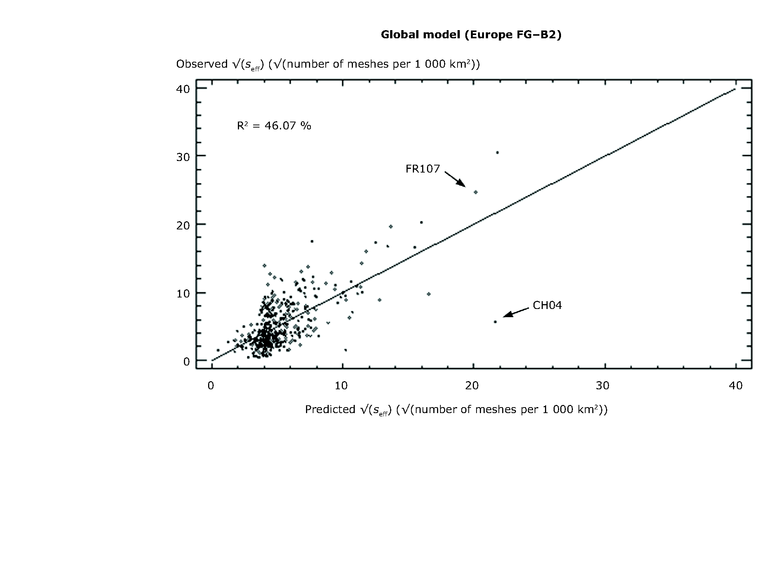
Effective mesh density values by NUTS-X region for Fragmentation Geometry FG-B2 in 2009. The NUTS-X regions represented by points above the diagonal line are more fragmented than predicted (e.g., FR107 Val de Marne) and those represented by by points below the diagonal line are less fragmented than predicted (e.g., CH04 Zurich).
Loading