All official European Union website addresses are in the europa.eu domain.
See all EU institutions and bodiesAn official website of the European Union | How do you know?
Environmental information systems
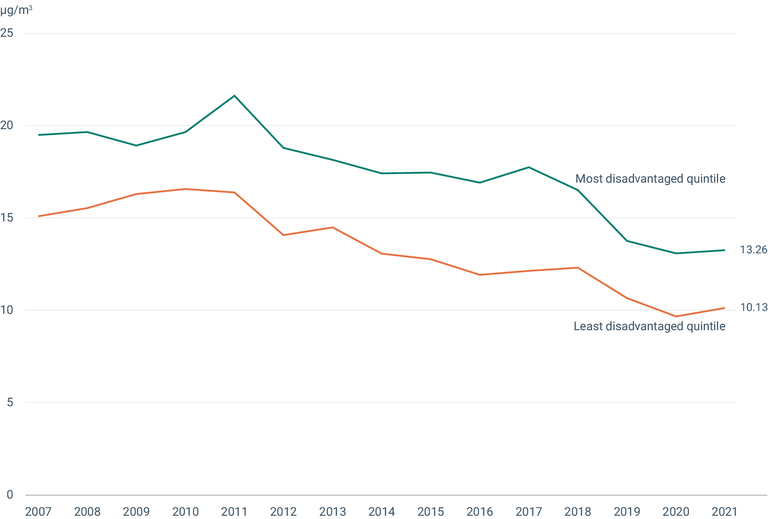
Population-weighted concentration of PM₂.₅ in the richest and poorest (as measured by GDP per capita, PPS) quintile of NUTS3 regions in the EU-27, 2007-2021
Chart (static)

Downloads
Data sources
Metadata
More info
Data-package.zip
Loading
- Gross domestic product (GDP) at current market prices by NUTS 3 regions [nama_10r_3gdp], Statistical Office of the European Union (Eurostat)
- Air Quality Health Risk Assessments (NUTS3 and countries), European Environment Agency (EEA)
- Austria
- Belgium
- Bulgaria
- Croatia
- Cyprus
- Czechia
- Denmark
- Estonia
- Finland
- France
- Germany
- Greece
- Hungary
- Ireland
- Italy
- Latvia
- Lithuania
- Luxembourg
- Malta
- Netherlands
- Poland
- Portugal
- Romania
- Slovakia
- Slovenia
- Spain
- Sweden
2007-2021
Methodology
The dataset of annual population weighted concentrations of PM₂.₅ by NUTS3 region was reorganized in quintiles according to the regions' GDP per capita (PPS), and the average concentration of the richest and lowest quintiles was found.
Additional information
- Population-weighting is a statistical technique that assigns greater weight to the air pollution experienced where most people live.
- GDP: Gross Domestic Product, a basic measure of the overall size of a country's or region's economy.
- Per capita (Latin: "per head") indicates the average per person in a group, in this case, the population of a given NUTS3 region.
- PPS: purchasing power standard, an artificial currency unit with which theoretically, one could buy the same amount of goods and services in each country. PPS is a more accurate way to compare wealth per capita than raw GDP because it reduces the effect of price differences.
- PM₂.₅, particulate matter with a diameter of 2.5μm or less.
