All official European Union website addresses are in the europa.eu domain.
Chart (static)Published 12 Nov 2009Modified 11 Sept 2024
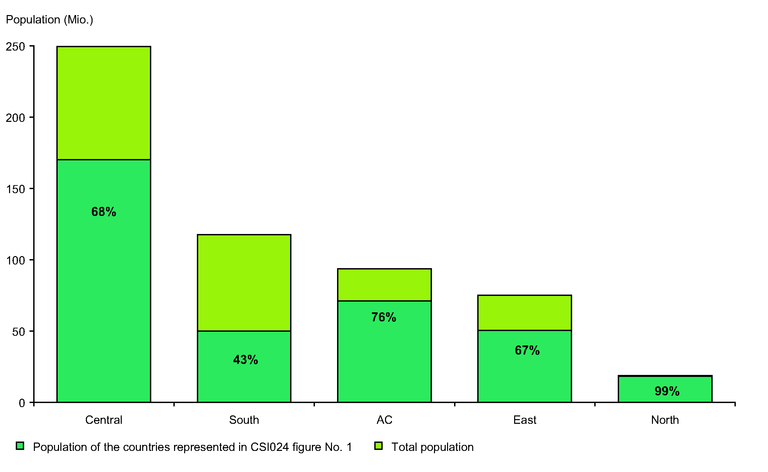
This figure (fig
a) support the graphic in Core set of Indicators CSI-024 (ver. 2) figure 1 Changes in wastewater treatment in regions of Europe between 1980s and late 1990s