All official European Union website addresses are in the europa.eu domain.
See all EU institutions and bodies
An official website of the European Union | How do you know?
Environmental information systems
EN

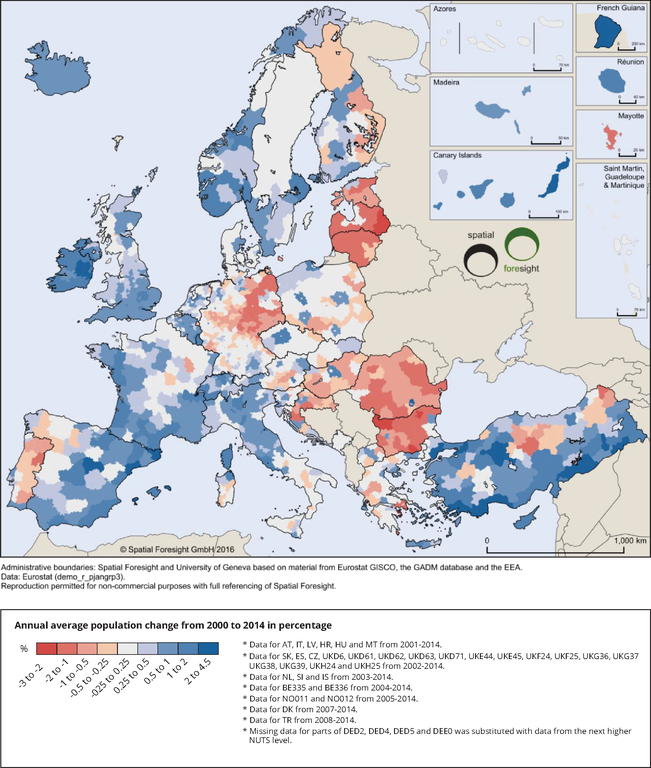
The observation of demographic trends at the NUTS3 levels between 2000 and 2014 reveals demographic decline across large parts of Central and Eastern Europe. In most of these areas, ‘islands’ of demographic growth can be observed around capital and metropolitan cities.
Loading