All official European Union website addresses are in the europa.eu domain.
See all EU institutions and bodiesAn official website of the European Union | How do you know?
Environmental information systems
EN
- БългарскиBG
- češtinaCS
- HrvatskiHR
- danskDA
- NederlandsNL
- ελληνικάEL
- EnglishEN
- eestiET
- SuomiFI
- FrançaisFR
- DeutschDE
- magyarHU
- ÍslenskaIS
- italianoIT
- LatviešuLV
- lietuviųLT
- MaltiMT
- NorskNO
- polskiPL
- PortuguêsPT
- RomânăRO
- slovenčinaSK
- SlovenščinaSL
- EspañolES
- SvenskaSV
- TürkçeTR
Pesticide sales by categorisation of active substances
Chart (static)
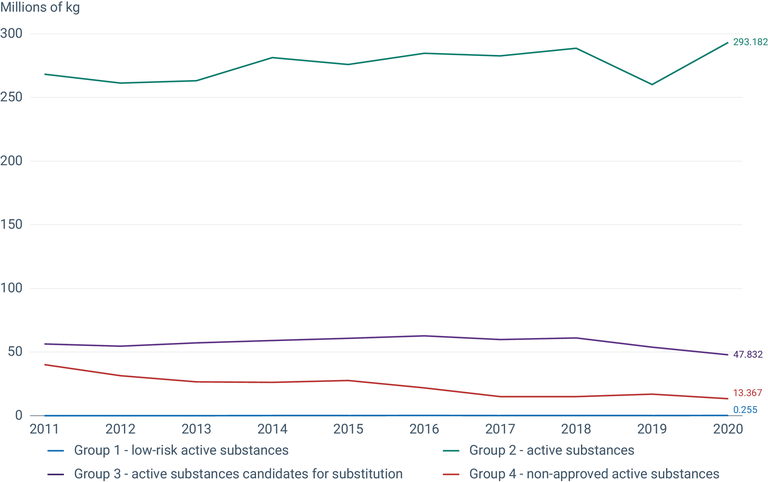
The substance categorisation in the legend mirrors what the European Commission uses to calculate its indicators on pesticide use and risk. Group 2 includes approved active substances that are neither low-risk nor candidates for substitution, which make up around 75% of all approved active substances in the EU according to the EU Pesticides Database. The hazard potential of substances in this group varies significantly.
Downloads
Data sources
Metadata
More info
Loading
- Pesticide sales by categorisation of active substances (AEI_PESTSAL_RSK)
- Eurostat (2022b).
2011-2020