All official European Union website addresses are in the europa.eu domain.
See all EU institutions and bodies
An official website of the European Union | How do you know?
Environmental information systems
EN

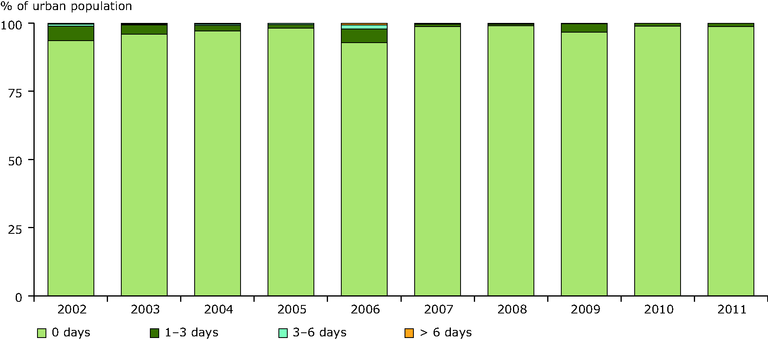
Monitoring data from AirBase provide the basis for
estimating the European population's exposure to
exceedances of the SO2 limit value of 125 µg/m3
as a daily average. According to the relevant
directive, this limit value should not to be exceeded
on more than three days in a year and was to be
met by 2005.
Loading