All official European Union website addresses are in the europa.eu domain.
See all EU institutions and bodiesAn official website of the European Union | How do you know?
Environmental information systems
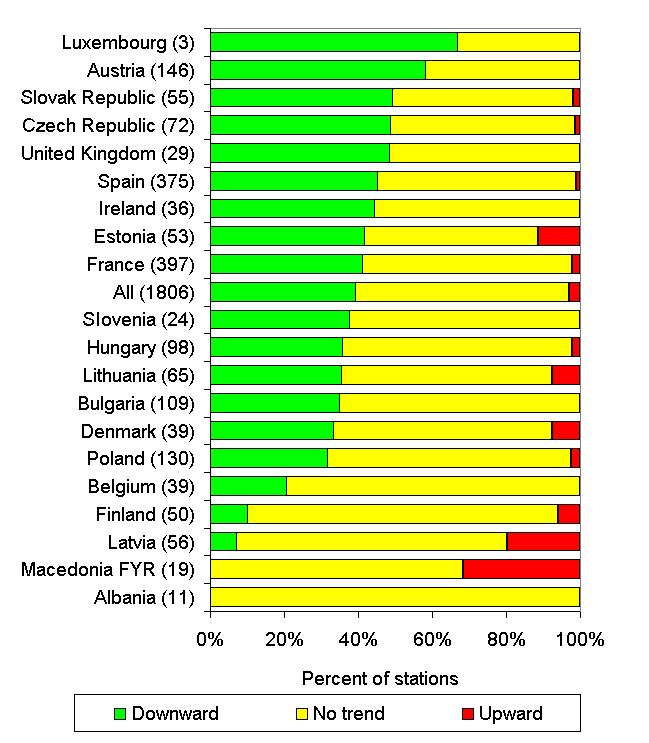
Percentage of river stations per country with significant increasing, stable or decreasing BOD trend between 1992 and 2006
Chart (static)
Number of river monitoring stations included in analysis noted in brackets

Downloads
Data sources
Metadata
More info
Loading
- Albania
- Austria
- Belgium
- Bosnia and Herzegovina
- Bulgaria
- Czechia
- Denmark
- Estonia
- Finland
- France
- Hungary
- Ireland
- Italy
- Latvia
- Lithuania
- Luxembourg
- North Macedonia
- Poland
- Slovakia
- Slovenia
- Spain
- United Kingdom
BOD5 data used for all countries except Estonia (EE) and Finland (FI) where only BOD7 data used. BOD7 data from Lithuania (LT) (1996-2006) and Latvia (LV) (1996-2001) have been recalculated into BOD5 data. Time series trends calculated, using only stations that have recorded concentrations for at least seven of the years included in the time series. Sen''s Test then applied to determine statistically significant trends in the data (see Methodology section for further details).
