All official European Union website addresses are in the europa.eu domain.
See all EU institutions and bodiesAn official website of the European Union | How do you know?
Environmental information systems
EN
- БългарскиBG
- češtinaCS
- HrvatskiHR
- danskDA
- NederlandsNL
- ελληνικάEL
- EnglishEN
- eestiET
- SuomiFI
- FrançaisFR
- DeutschDE
- magyarHU
- ÍslenskaIS
- italianoIT
- LatviešuLV
- lietuviųLT
- MaltiMT
- NorskNO
- polskiPL
- PortuguêsPT
- RomânăRO
- slovenčinaSK
- SlovenščinaSL
- EspañolES
- SvenskaSV
- TürkçeTR
Percentage of contaminated sites by polluting activity related to the extractive sector
Chart (static)
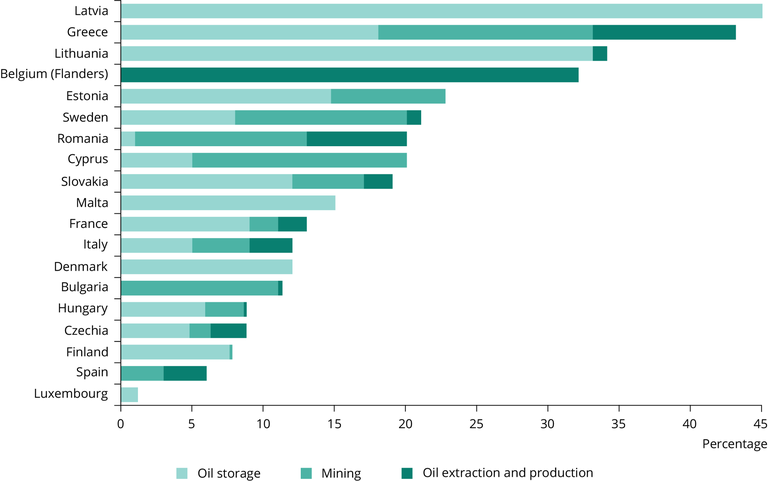
Data are only available for some EU countries, and are not currently suitable for monitoring trends. The data reflects the percentage of all reported contaminated sites, without considering site size or the type of activity. Sites are locations where soil contamination has been verified by site investigations.
Downloads
Data sources
Metadata
More info
Loading
- Progress in the Management of Contaminated Sites in Europe (dataset URL is not available)
Bulgaria, Cyprus, Czechia, Denmark, Estonia, Finland, Flanders, France, Greece, Hungary, Italy, Latvia, Lithuania, Luxembourg, Malta, Romania, Slovakia, Spain, Sweden
2006
2011
Additional information
- The chart use data from 2011 and 2006. Due to in 2011 not covered or presenting not reliable data for the following countries: Bulgaria, Czech Republic, Denmark, Greece, Hungary, Luxembourg, Romania, Spain, Sweden.
- Mining: Percentage of contamination due to local sources relating to mining operations (incl. area or areas of excavation and adjoining areas or nearby facilities for materials handling, processing and waste disposal).
- The figure includes polluting sources that contribute to the total amount of local contamination, verified by site investigations.