All official European Union website addresses are in the europa.eu domain.
See all EU institutions and bodies
An official website of the European Union | How do you know?
Environmental information systems
EN

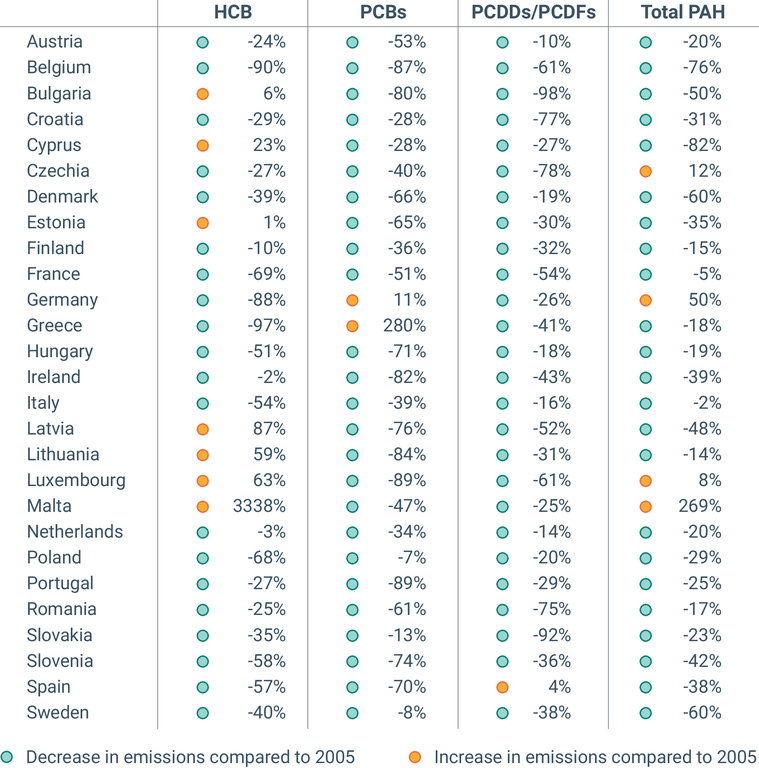
The figure shows the difference in emissions of Persistent Organic air Pollutants (POPs) of individual Member States in 2022 compared to 2005 levels.
Loading