All official European Union website addresses are in the europa.eu domain.
See all EU institutions and bodies
An official website of the European Union | How do you know?
Environmental information systems
EN

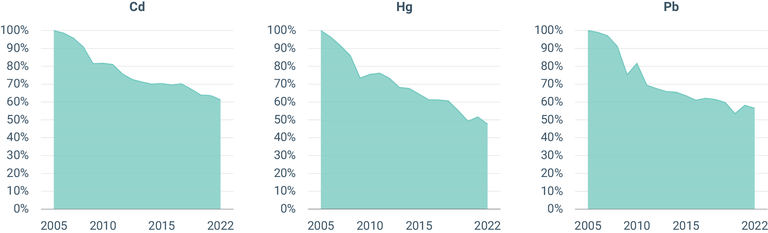
The figure shows the difference in emissions of the heavy metals between 2005 and 2022.
Loading