All official European Union website addresses are in the europa.eu domain.
See all EU institutions and bodiesAn official website of the European Union | How do you know?
Environmental information systems
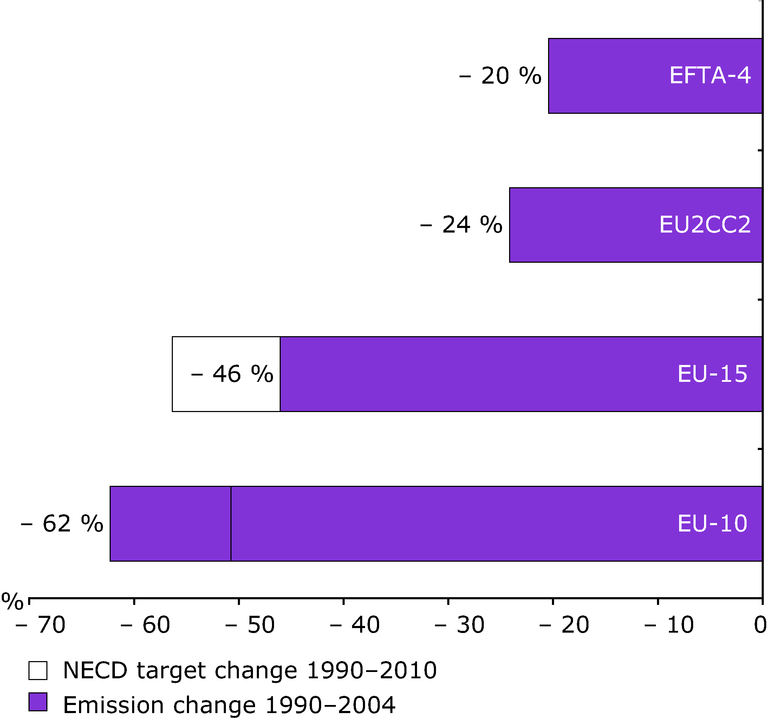
Percentage changes in emissions of acidifying substances (SO2, NOX and NH3) over the period 1990 to 2004, and comparison with NEC Directive targets
Chart (static)

Downloads
Data sources
Metadata
More info
Loading
- Austria
- Belgium
- Cyprus
- Czechia
- Denmark
- Estonia
- Finland
- France
- Germany
- Greece
- Hungary
- Ireland
- Italy
- Latvia
- Lithuania
- Luxembourg
- Malta
- Netherlands
- Poland
- Portugal
- Slovakia
- Slovenia
- Spain
- Sweden
- United Kingdom
