next
previous
items

Figure

Peak and 2100 concentrations of total greenhouse gases in the atmosphere consistent with a 67 % probability of keeping the average global temperature increase below 1.5°C (left) and 2°C (right)

Figure Created 15 Dec 2021 Published 15 Dec 2021 Last modified 19 Jan 2023
1 min read
This is an old version, kept for reference only.

Go to latest version
This page was archived on 19 Jan 2023 with reason: Other (New version data-and-maps/figures/peak-and-2100-concentrations-of-2 was published)
Peak and 2100 concentrations of total greenhouse gases in the atmosphere consistent with a 67% probability of keeping the average global temperature increase below 1.5°C (left) and 2°C (right) are shown. 
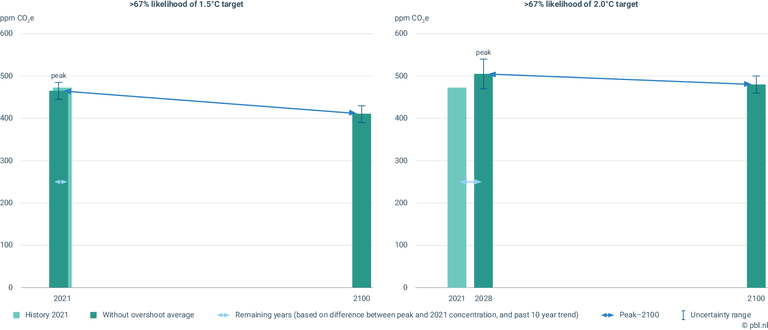
The periods within which peak concentrations could be exceeded are shown by purple arrows, based on the trend of the past 10 years in total greenhouse gas concentrations and without allowing for a temperature overshoot (based on IPCC, 2019)

European data

Metadata

Permalinks

Geographic coverage

Temporal coverage

Topics

Tags

Filed under:
Filed under: climate policy targets
Document Actions