All official European Union website addresses are in the europa.eu domain.
See all EU institutions and bodies
An official website of the European Union | How do you know?
Environmental information systems
EN

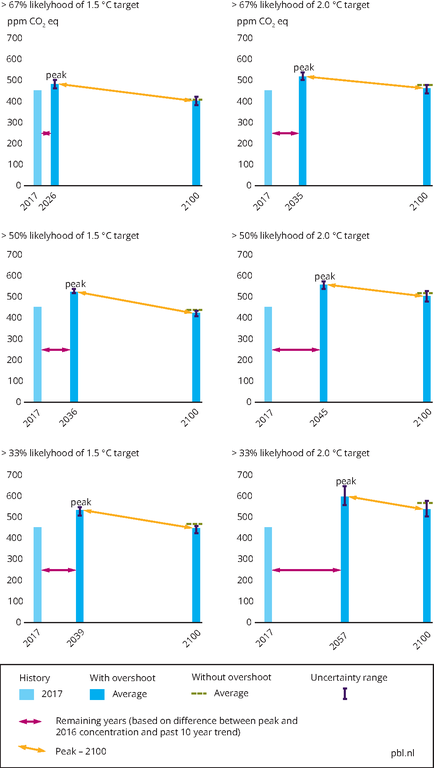
The number of years within which the peak concentration levels could be exceeded are indicated by the purple arrows, given the trend in total greenhouse gas concentrations over the past 10 years (based on IPCC, 2018)
Loading