All official European Union website addresses are in the europa.eu domain.
See all EU institutions and bodiesAn official website of the European Union | How do you know?
Environmental information systems
EN
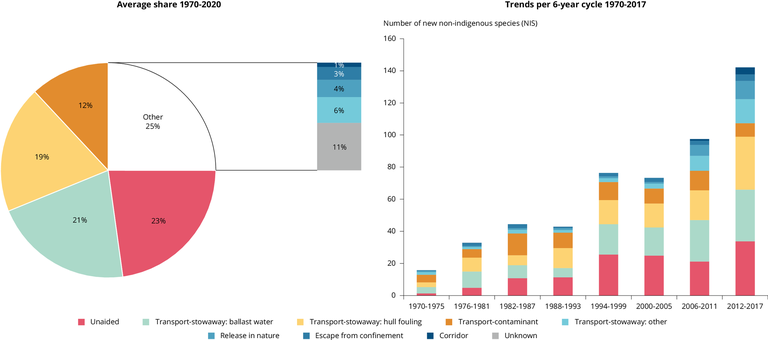
The pie chart shows the share of the different pathways of introduction of new non-indigenous species (NIS) to Europe's seas over the years 1970 to 2020. The category 'Other' includes several modes of introduction, namely 'Transport-stowaway: other', 'release in nature', 'escape from confinement', 'corridor' and 'unknown'. The stacked column chart shows the trend in the number of new NIS by pathway of introduction between 1970 and 2017, on a 6-year cycle. While introductions by Transport-Stowaway (ballast water, hull fouling and others) remain the prevalent mode, 'unaided' and 'escape from confinement' have grown in importance in the latest assessment cycles.
Loading