All official European Union website addresses are in the europa.eu domain.
See all EU institutions and bodiesAn official website of the European Union | How do you know?
Environmental information systems
EN
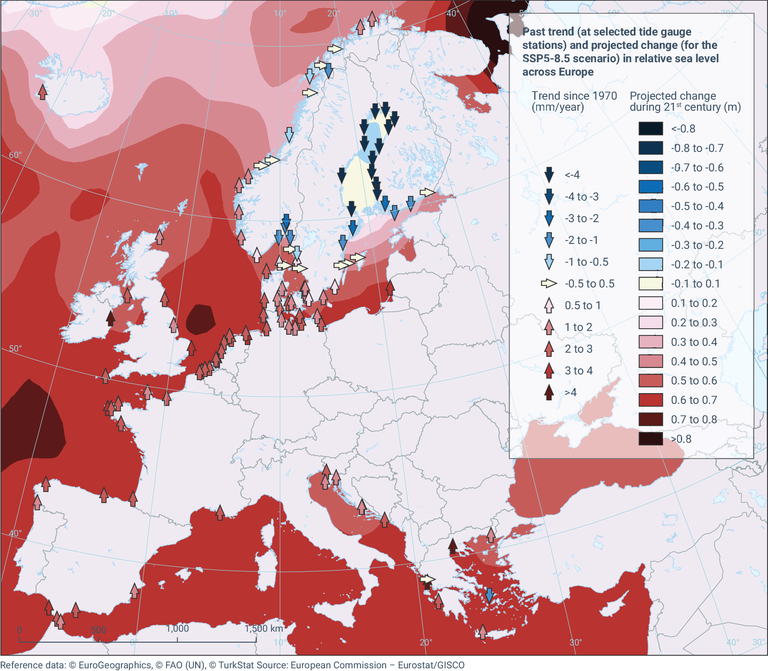
The arrows show the observed trend in sea level relative to land since 1970 for those tide gauges along the Europe coastline with sufficiently long time series (mm/year). Projections: European sea level change for 2081–2100 for SSP5-8.5 in metres. Results use CMIP6 model projections for long term scenario (2081-2100), for SSP5-8.5, and with respect to a baseline of 1995-2014.
Loading