All official European Union website addresses are in the europa.eu domain.
See all EU institutions and bodiesAn official website of the European Union | How do you know?
Environmental information systems
EN
- БългарскиBG
- češtinaCS
- HrvatskiHR
- danskDA
- NederlandsNL
- ελληνικάEL
- EnglishEN
- eestiET
- SuomiFI
- FrançaisFR
- DeutschDE
- magyarHU
- ÍslenskaIS
- italianoIT
- LatviešuLV
- lietuviųLT
- MaltiMT
- NorskNO
- polskiPL
- PortuguêsPT
- RomânăRO
- slovenčinaSK
- SlovenščinaSL
- EspañolES
- SvenskaSV
- TürkçeTR
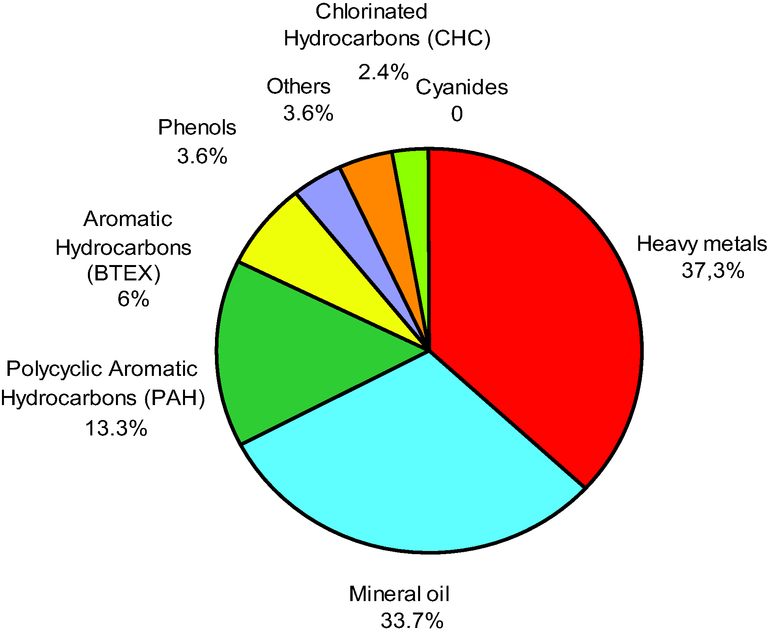
Overview of contaminants affecting soil and groundwater in Europe
Chart (static)
The graph shows an overview of main contaminants affecting soil
Downloads
Data sources
Metadata
More info
Loading
Austria, Belgium, Czechia, Finland, Greece, Hungary, Italy, Luxembourg, North Macedonia, Slovakia, Spain, Sweden
The ranking of contaminants is calculated on the basis of the frequency a specific contaminant is reported to be the most important in the investigated sites: Ranking = (number of countries reporting the specific contaminant as the most important)*2 + (number of countries reporting the specific contaminant as the second most important). Maximum possible score: 37 Data for Belgium refer to the Flanders and the Brussels region only. Data for Italy refer to three out of 20 regions only. Data Coverage: Austria, Belgium, Czech Republic, Finland, FYR of Macedonia, Greece, Hungary, Italy, Luxembourg, Macedonia, Slovakia, Spain, Sweden Time coverage: 2006