All official European Union website addresses are in the europa.eu domain.
See all EU institutions and bodiesAn official website of the European Union | How do you know?
Environmental information systems
EN
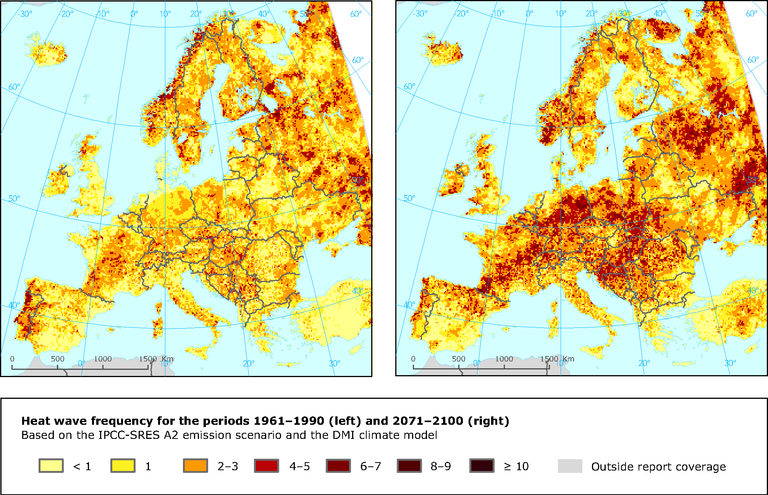
Occurrence of heat wave events with a duration of 7 days (left: 1961-1990 average; right: 2071-2100 average)
Loading