All official European Union website addresses are in the europa.eu domain.
See all EU institutions and bodiesAn official website of the European Union | How do you know?
Environmental information systems
EN
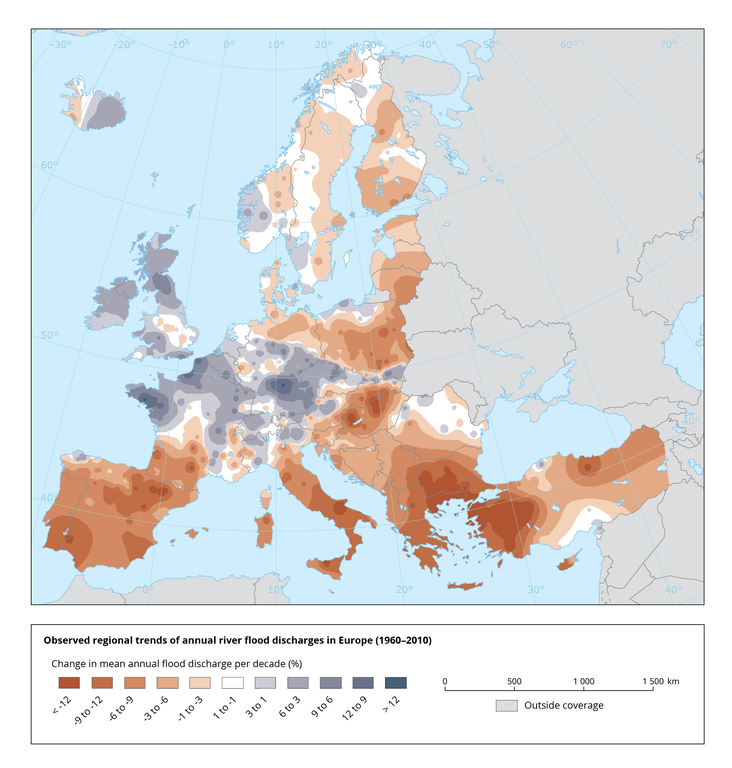
This maps show the linear trend in the annual maximum of daily river discharge over the period 1960-2010. Blue indicates increasing flood discharges and red denotes decreasing flood discharges (in per cent change of the mean annual flood discharge per decade).
Loading