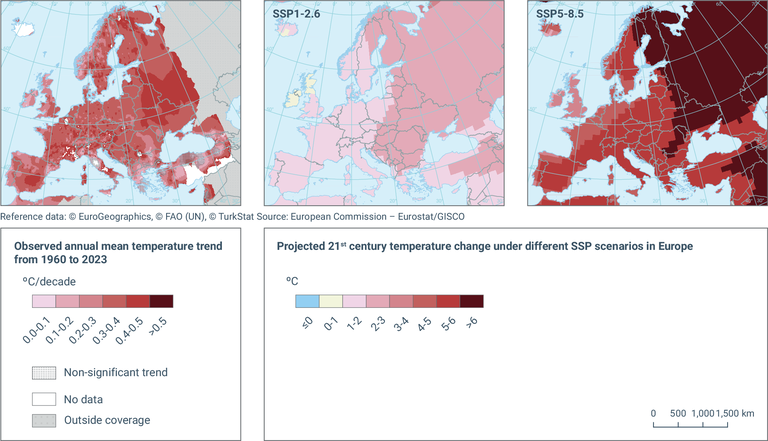
Observed annual mean temperature trend from 1960 to 2023 (left panel) and projected 21st century temperature change under different SSP scenarios (right panels) in Europe
Map (static)
Left panel: Observed temperature trend from stations available in the European Climate Assessment and Datasets (ECA&D) (with different lengths of records) for daily temperature.
Right panel: - Left map: Projected temperature change between the WMO reference period 1981-2010 and the end of the 21st century (period 2081-2100) under the scenario SSP1-2.6. - Right map: Projected temperature change between the WMO reference period 1981-2010 and the end of the 21st century (period 2081-2100) under the scenario SSP5-8.5.
Downloads
Data sources
Metadata
More info
Loading
CMIP6 - Mean temperature (T) Change deg C - Long Term (2081-2100) SSP1-2.6 (rel. to 1981-2010) - Annual (32 models)
CMIP6 - Mean temperature (T) Change deg C - Long Term (2081-2100) SSP5-8.5 (rel. to 1981-2010) - Annual (34 models)
Daily mean temperature, E-OBS gridded dataset version 29.0e update
Left panel: Figure 2a shows the linear trend of mean annual temperature over the period 1960-2023. A two-sided Student's t test for the null hypothesis of no trend is applied and grid cells with non-statistically significant results are hatched.
Right panel:
Left map: Data are based on the ensemble mean of 32 global CMIP6 models, results are interpolated onto the CMIP6 reference grid of 1 x 1 degrees using a conservative method, temporal aggregation is carried out by calculating mean values from daily data for the whole period. Data shown in the map are calculated for each grid cell as the arithmetic difference between historical projection 1981–2010 and future projection for the period 2081-2100 using the SSP1-2.6 scenario.
Right map: Data are based on the ensemble mean of 34 global CMIP6 models, results are interpolated onto the CMIP6 reference grid of 1 x 1 degrees using a conservative method, temporal aggregation is carried out by calculating mean values from daily data for the whole period. Data shown in the map are calculated for each grid cell as the arithmetic difference between historical projection 1981-2010 and future projection for the period 2081-2100 using the SSP5-8.5 scenario.
Both maps: Shared Socioeconomic Pathways (SSP) scenarios are the new scenarios representing different socio-economic developments as well as different pathways of atmospheric greenhouse gas concentrations. Five narratives describe different paths of economy and society (SSP1-SSP5) from the sustainable and “green” pathway (SSP1) to fossil-fueled development and integration of global markets (SSP5). Individual scenarios are followed by two numbers indicating the additional radiative forcing achieved by the year 2100 in units of watts per square meter.
Units
Left panel: °C/decade
Right panel: °C
Additional information
Right panels: Data of Coupled Model Intercomparison Project Phase 6 (CMIP6) coordinated by the Working Group on Coupled Modelling (WGCM) as part of the World Climate Research Programme (WCRP). The data of this modeling initiative are used in the IPCC AR6 report.