All official European Union website addresses are in the europa.eu domain.
See all EU institutions and bodiesAn official website of the European Union | How do you know?
Environmental information systems
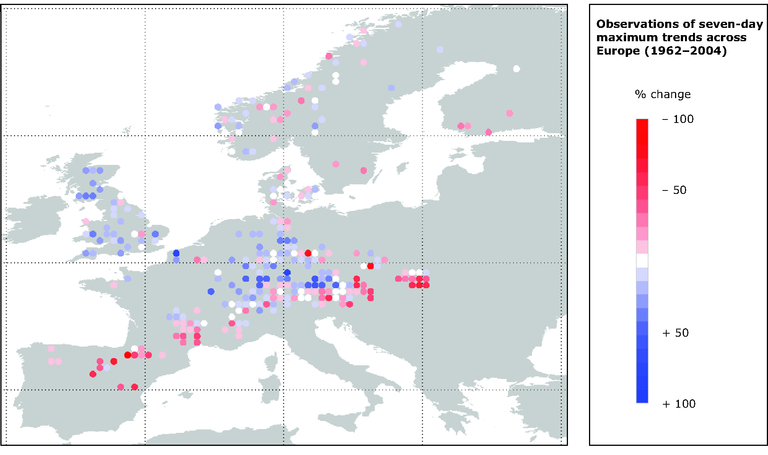
Observations of seven-day maximum trends across Europe (1962–2004)
Map (static)
Trends as % of change

Downloads
Data sources
Metadata
More info
Loading
- Flow Regime for International Experiment and Network Data (FRIEND) based on Unesco's European Water Archive (EWA)
- Austria
- Belgium
- Czechia
- Denmark
- Europe
- Finland
- France
- Germany
- Hungary
- Luxembourg
- Netherlands
- Norway
- Poland
- Romania
- Slovakia
- Spain
- Sweden
- Switzerland
- United Kingdom
1962-2004
