All official European Union website addresses are in the europa.eu domain.
See all EU institutions and bodies
An official website of the European Union | How do you know?
Environmental information systems
EN

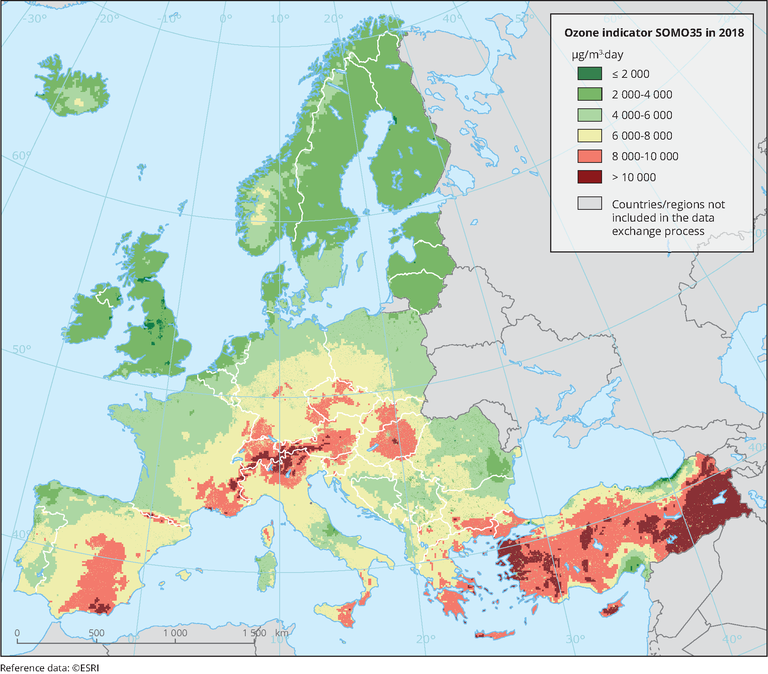
The map represents the calculated concentrations of O3 (SOMO35) combining monitoring data at regional and urban background stations with results from the European Monitoring and Evaluation Programme (EMEP) chemical transport model and other supplementary data.
Loading