All official European Union website addresses are in the europa.eu domain.
See all EU institutions and bodies
An official website of the European Union | How do you know?
Environmental information systems
EN

- БългарскиBG
- češtinaCS
- HrvatskiHR
- danskDA
- NederlandsNL
- ελληνικάEL
- EnglishEN
- eestiET
- SuomiFI
- FrançaisFR
- DeutschDE
- magyarHU
- ÍslenskaIS
- italianoIT
- LatviešuLV
- lietuviųLT
- MaltiMT
- NorskNO
- polskiPL
- PortuguêsPT
- RomânăRO
- slovenčinaSK
- SlovenščinaSL
- EspañolES
- SvenskaSV
- TürkçeTR
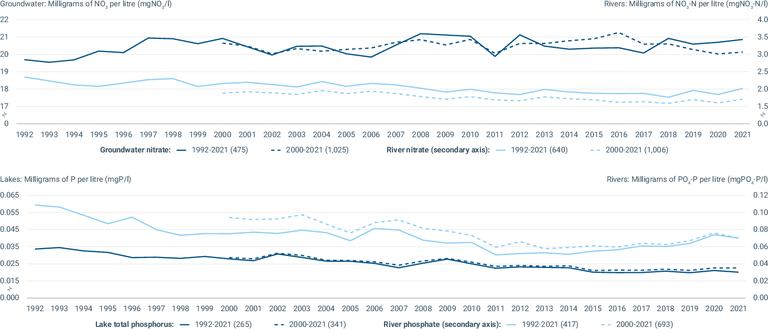
Nutrients in European water bodies
Chart (static)
This figure shows the trends in nitratre concentrations in European rivers and groundwater and the trends in phosphorus in European lakes and rivers
Downloads
Data sources
Metadata
More info
Loading
- Waterbase - Water Quality ICM, 2022
- Albania
- Austria
- Belgium
- Bulgaria
- Croatia
- Cyprus
- Czechia
- Denmark
- Estonia
- Finland
- France
- Germany
- Iceland
- Ireland
- Italy
- Latvia
- Lithuania
- Netherlands
- North Macedonia
- Norway
- Poland
- Portugal
- Romania
- Serbia
- Slovakia
- Slovenia
- Spain
- Sweden
- Switzerland
1992-2021
Methodology
The data series are calculated as the average of annual mean concentrations for specific sites and water bodies in Europe. Only complete time series after inter/extrapolation are included (see indicator's "Methodology" section).
Units
Upper chart:
Groundwater: (mgNO₃/l) and Rivers: (mgNO₃-N/l)
Lower chart:
Lakes: (mgP/l) and Rivers: (mgPO4-P/l)
Additional information
Two time series are shown – a longer time series representing fewer water bodies and a shorter time series representing more water bodies.
Upper chart:
Nitrate in groundwater: The number of groundwater bodies included per country is given in parenthesis:
- 1992-2021: Europe (475), Austria (14), Belgium (24), Bulgaria (25), Denmark (1), Estonia (16), Finland** (7), France (260), Germany (67), Ireland (49), Portugal (2), Slovakia (4), Slovenia (5), Spain (1).
- 2000-2021: Europe (1025), Austria (14), Belgium (37), Bulgaria (40), Cyprus (6), Czechia (64), Denmark (4), Estonia (18), Finland** (8), France (452), Germany (176), Ireland (66), Italy (10), Latvia (11), Malta (2), Portugal (10), Serbia (21), Slovakia (16), Slovenia (6), Spain (25), Switzerland (37).
Nitrate in rivers: The number of river monitoring sites included per country is given in parenthesis:
- 1992-2021: Europe (640), Albania (3), Belgium (26), Czechia (22), Denmark* (36), Estonia (34), Finland** (60), France** (3), Germany (119), Ireland** (4), Latvia (13), Lithuania (22), Poland (13), Slovakia (8), Slovenia (7), Spain** (154), Sweden* (110), Switzerland (6).
- 2000-2021: Europe (1006), Albania (7), Belgium (34), Cyprus (13), Czechia (22), Denmark* (37), Estonia (36), Finland** (69), France** (3), Germany (122), Iceland (1), Ireland** (50), Italy (25), Latvia (16), Lithuania (22), North Macedonia (17), Poland (16), Romania (89), Serbia (33), Slovakia (8), Slovenia (8), Spain** (250), Sweden* (112), Switzerland (16).
(* = all data total oxidised nitrogen, ** = some data total oxidised nitrogen)".
Lower chart:
Phosphate in rivers: The number of river monitoring sites included per country is given in parenthesis:
- 1992-2021: Europe (417), Belgium (24), Bulgaria (32), Czechia (10), Denmark (38), Estonia (35), Finland (59), Ireland (4), Latvia (13), Lithuania (22), Norway (18), Slovakia (6), Slovenia (7), Spain (33), Sweden (110), Switzerland (6).
- 2000-2021: Europe (417), Albania (3), Belgium (28), Bulgaria (53), Croatia (23), Czechia (10), Denmark (39), Estonia (37), Finland (66), Iceland (1), Ireland (33), Italy (18), Latvia (16), Lithuania (22), Norway (18), Romania (88), Serbia (33), Slovakia (6), Slovenia (8), Spain (46), Sweden (112), Switzerland (16).
Total phosphorus in lakes: The number of lake monitoring sites included per country is given in parenthesis:
- 1992-2021: Europe (265), Austria (5), Denmark (5), Estonia (7), Finland (143), Germany (3), Lithuania (2), Netherlands (6), Norway (2), Slovenia (2), Sweden (90).
- 2000-2021: Europe (341), Austria (27), Belgium (1), Bulgaria (1), Croatia (3), Denmark (5), Estonia (8), Finland (167), France (1), Germany (6), Lithuania (3), Netherlands (6), Norway (3), Poland (9), Serbia (3), Slovenia (3), Sweden (95).