All official European Union website addresses are in the europa.eu domain.
See all EU institutions and bodiesAn official website of the European Union | How do you know?
Environmental information systems
EN
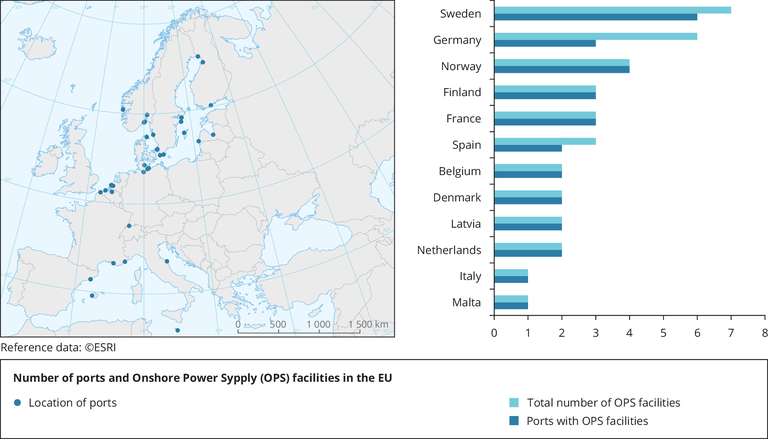
The map describes the number OPS facilities available in the EEA area. The graph describes the number of ports equipped with OPS facilities in the EU and the total number of OPS facilities available.
Loading