All official European Union website addresses are in the europa.eu domain.
See all EU institutions and bodiesAn official website of the European Union | How do you know?
Environmental information systems
EN
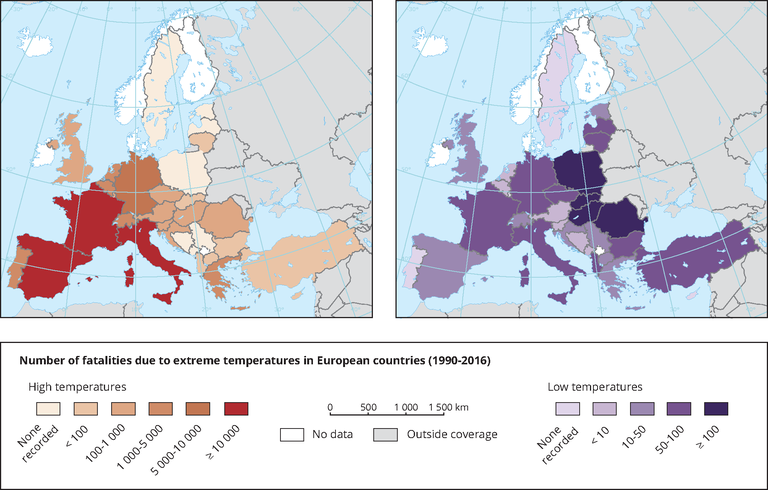
This map presentes the number of people who died as a result of extremely low temperatures and cold weather spells between 1990 and 2016.
Loading