All official European Union website addresses are in the europa.eu domain.
See all EU institutions and bodies
An official website of the European Union | How do you know?
Environmental information systems
EN

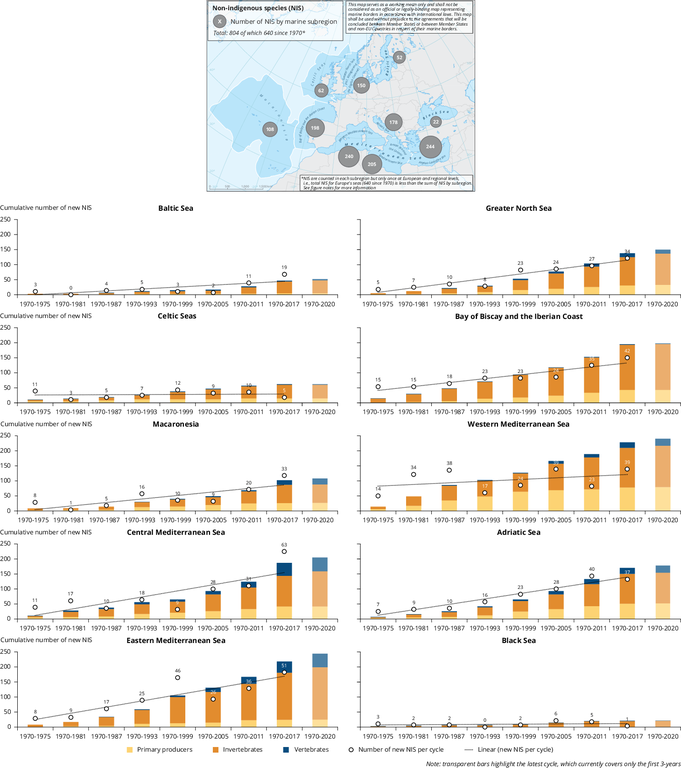
The combo charts show the number of new introductions of non-indigenous species (NIS) (dots with trendline, primary axis) and the cumulative number of NIS by main species group (stacked columns, secondary axis) reported in Europe’s marine subregions, per 6-year interval between 1970 and 2017.
Loading